
Human Development and Urbanism
by Richard Leete
Last updated on 20 July 2026

Cities are the main beneficiaries of globalisation—the increasing integration and interdependence of the world’s economies. People follow jobs, which follow investment and economic activities. Most are increasingly concentrated around dynamic urban areas of all sizes, but especially capital cities.
The nature of city growth has changed. In recent decades, two patterns of change have been most salient: the speed of urban growth in less developed countries, and the growth of megacities. While still a major feature, megacities (those with populations of 10 million or more) have not grown to the sizes once projected, accounting for just 9% of the total urban population.1
There is a high correlation between level of urbanisation and development. The countries and cities of Southeast Asia span a wide range, with Singapore, Brunei Darussalam2 and Malaysia3 being the most advanced, and Laos, Cambodia and Vietnam the least advanced. All countries of the region are expected to attain higher levels of urbanisation and human development. This essay reviews urban population growth and its linkages with human development4 and the achievement of the United Nations Millennium Development Goals (MDGs) in the countries of Southeast Asia.
POPULATION GROWTH AND THE NEW WAVE OF URBANISATION
The world is at the point of a significant urban transition. In 2008, the world’s urban population numbers, totalling over 3.3 billion, have surpassed the size of rural populations. At the global level, all future population growth will occur in towns and cities, 95% of it in the developing world. These population trends follow expectations given the structural transition of employment away from agriculture and towards urban manufacturing and service industries. Both the number and proportion of urban dwellers will continue to rise rapidly (Figure 1). By 2030, the world’s urban population is projected to grow by 48% to 4.9 billion. In contrast, the world’s rural population is expected to decline.1
Within Southeast Asia, levels of urbanisation have grown sharply over the past 25 years and are expected to continue to rise, particularly for Malaysia, Indonesia and the Philippines (Figure 1). The increases in urban population in the countries of Southeast Asia are part of a second wave of demographic, economic and urban transitions, much bigger and faster than the first in Europe and North America that began in the 18th century. These latter two regions experienced the first demographic transition, the first industrialisation and the first wave of urbanisation.
FIGURE 1. ESTIMATED AND PROJECTED URBANISATION, SOUTHEAST ASIAN COUNTRIES, 1980, 2005 AND 2030. (SOURCE OF DATA: UNITED NATIONS DEPARTMENT OF ECONOMIC AND SOCIAL AFFAIRS, WORLD URBANISATION PROSPECTS: THE 2005 REVISION5)
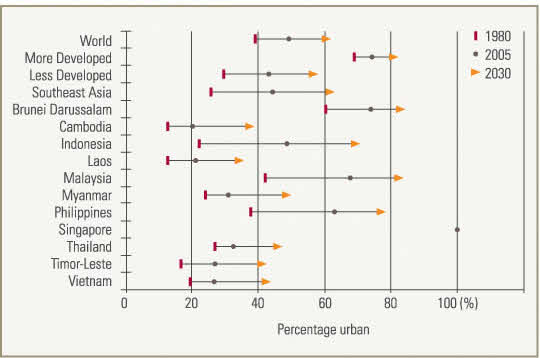
In the past half-century, the less developed countries have begun similar transitions. In both instances, population and economic growth have propelled the urban transition, but the speed and scale of urbanisation today are far greater and the challenges more daunting. Rapidly expanding cities require new infrastructure and communications—including power, water, roads, and commercial and productive facilities—more urgently than cities during the first wave of urbanisation did. Economies must be competitive in terms of infrastructure and technology if they are to succeed in the globalised world of the 21st century.
The second wave of urbanisation is also differentiated by the diminished role of international migration that, in the first wave, had relieved the pressure on cities in the developing countries. Contemporary urbanisation, this time in less developed countries, is driven primarily by natural increase and rural-to-urban migration.
CITIES AS CENTRES OF ECONOMIC AND POPULATION GROWTH
No country in the modern era has achieved significant economic growth without urbanisation. Southeast Asian cities are playing an ever-increasing role in creating wealth, attracting investment, enhancing social development, and harnessing both human and technical resources for achieving gains in productivity and competitiveness. Urban settlements tend to account for a larger share of national income, outpacing national economic growth. For example, Bangkok, which comprises just over 10% of the total population of Thailand, accounts for more than 40% of the country’s gross domestic product.6
It is relatively small cities that will absorb the bulk of urban population growth in the foreseeable future.
Cities are key to globalisation, a state of interconnectedness around the globe that transcends and, for many purposes, largely ignores national boundaries. The shrinking of the globe through the continuing technological revolution makes it possible for business enterprises to utilise services from anywhere in the world. Global urban economies rely on advanced knowledge-based services, such as finance, insurance, management consultancy, education, media and advertising.
The cities of Southeast Asia are increasingly providing customer services at competitive rates by drawing on a large and increasingly more educated and relatively low-cost labour force. Three notable examples of hubs of global activity for specialised services in Southeast Asia are Singapore, which has a major role as an international finance centre, and as sea and air transport hubs; Bangkok, which hosts many regional headquarters for corporations and international agencies; and Kuala Lumpur, which has a multimedia super-corridor, with Cyberjaya and Technology Park Malaysia forming its nuclei.
Huge, sprawling conurbations—megacities and metacities (cities with more than 20 million inhabitants)—have changed the dynamics of urbanisation and the urban economy. People active in both the formal and informal sectors commute long distances to work, to and from densely populated outlying towns or suburbs. In cities such as Jakarta, Bangkok and Manila, and even in the craft and industry villages in Vietnam’s Red River Delta, the economic base spreads outwards along urban corridors to peri-urban localities that are cheaper and less strictly regulated. Secondary cities and city systems, often located along these corridors, become interconnected through manufacture and ancillary business enterprises.7
Despite the prominence given to large cities, more than 53% of the world’s urban population lives in cities of fewer than 500,000 inhabitants, and 60% in cities of less than 1 million.5 It is these relatively small cities that will absorb the bulk of urban population growth in the foreseeable future. The relatively smaller cities are gaining ever more prominence, especially those in the Philippines and Indonesia.
Infrastructure investments in urban areas can be cost-effective. The concentration of population and enterprises in urban areas greatly reduces the unit cost of piped water, sewers, drains, roads, electricity, garbage collection, transport, healthcare and schools. However, the cost-effectiveness of such investments is reduced when they are made too late. For instance, when informal settlements or slums are allowed to proliferate, it becomes more difficult and more expensive to install infrastructure and services because no prior provision has been made for the settlement’s development. Moreover, population densities and the spatial configuration of slums often do not allow for the subsequent development of roads, sewerage systems and other facilities that are easy to install in less dense and better-planned localities.
INCREASED HUMAN DEVELOPMENT AMONG CITY POPULATIONS
The concept of cities as islands of privilege and opportunity is supported by indicators on health, education and income, which generally reflect better outcomes in urban areas as compared with rural areas. However, with increased globalisation, the urban transition is widening gaps between social groups and is making inequality more visible. Large cities generate creativity and solidarity, but also make conflicts more acute.
Severe inequalities within cities are exacerbated by political and social exclusion. One reality of a rapidly urbanising world is the rise in relative poverty in cities brought about by large differentials in income and consumption between the haves and the have-nots. National statistics tend to underestimate levels of urban poverty, which is often relative rather than absolute. Moreover, the measurement of poverty in both rural and urban areas is generally based on income, which does not necessarily provide an accurate picture of the scale and multidimensional nature of poverty. One view is that urban poverty is a transient phenomenon of rural-to-urban migration and will disappear as cities develop, thus absorbing the poor into the mainstream of urban society. This view is reflected in most national poverty reduction strategies, which tend to be rural-focused with the result that interventions have had limited effect in reducing relative poverty, exclusion and inequality in cities.
UN-Habitat’s State of the World’s Cities 2006/7 Report6 notes that it is generally assumed that urban populations are healthier, more literate, and more prosperous than rural populations, but in fact the urban poor suffer from ‘an urban penalty’: urban slum dwellers in developing countries are as badly off, if not worse off than their rural relatives.8 Some slums are much worse than others.
Large cities generate creativity and solidarity, but also make confl icts more acute.
However, slums in Southeast Asian cities are less deprived, with only 26% of the slum populations living in conditions of extreme shelter deprivation.6 Indeed, the proportion of slum dwellers in Southeast Asian cities has itself declined in recent years.
For example, Thailand has not only managed to reduce slum growth in the last 15 years but has made considerable investment in improving its slums through specific upgrading and prevention policies. The Philippines and Indonesia have managed to prevent slum formation by anticipating and planning for growing urban populations. They have done this by expanding economic and employment opportunities for the urban poor, investing in low-cost, affordable housing for the most vulnerable groups, and instituting pro-poor reforms and policies that have had a positive impact on low-income people’s access to services. Similarly, in Bandar Seri Begawan, Brunei Darussalam, most houses have access to piped water and electricity supplied by public utilities.
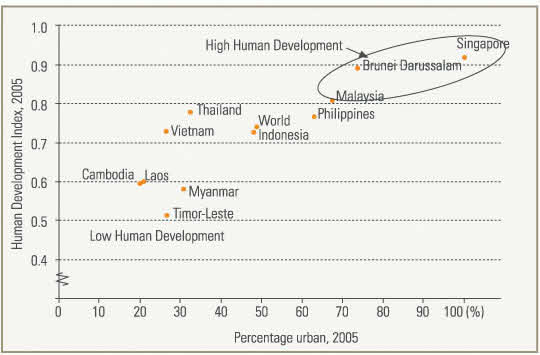
As countries become more urban, levels of human development tend to rise. This phenomenon is clearly visible for the countries of Southeast Asia (Figure 2). For example, Malaysia and the Philippines, where urbanisation levels have reached 67% and 63% respectively, have attained or are close to attaining high human development. By contrast, Cambodia and Laos, where urbanisation is just 20%, are a little above low human development.9
FIGURE 2. RELATIONSHIP BETWEEN HUMAN DEVELOPMENT AND THE PROPORTION URBAN, SOUTHEAST ASIAN COUNTRIES. (SOURCES OF DATA: UNITED NATIONS DEPARTMENT OF ECONOMIC AND SOCIAL AFFAIRS, WORLD URBANIZATION PROSPECTS: THE 2005 REVISION;5 UNDP, HUMAN DEVELOPMENT REPORT, 2007/0810)
ACHIEVING THE MILLENNIUM DEVELOPMENT GOALS IN CITIES
Although cash income is more important in cities than in villages, income poverty is only one aspect of urban poverty. The other indicators of poverty are poor health and lack of education, poor quality and overcrowded shelter, and lack of public services such as piped water, sanitation facilities, and garbage collection, as well as insecure land tenure.
Water, for example, is a scarce and expensive resource for the urban poor.11 It is obtained in small quantities from street vendors, which entails higher unit costs than those incurred by people who have running water in their homes. If there is piped supply, obtaining it may involve long journeys to the neighbourhood standpipe (commonly by women and girls), long waits, tiring trips back home with full containers, careful storage to minimise wastage, and reuse of the water several times, increasing the risk of contamination.
As levels of urbanisation rise and the benefits of modernisation spread, gender gaps tend to diminish. Thus, in the most urbanised Southeast Asian countries, the ratio of girls’ to boys’ enrolments in secondary school is at, and even above, parity. However, where urbanisation has made limited progress, such as in Cambodia and Laos, the proportion of girls’ enrolments in secondary school is much lower than that of boys.
Accessing healthcare, especially reproductive healthcare, is critical for women, not only because of their reproductive function and that they are disproportionately burdened with providing care for the elderly and the sick, but also because they do more to relieve poverty at the community level. Not all urban women have equal access to reproductive healthcare or contraceptive services. For poor women, lack of time, money and freedom to make household decisions, can negate these advantages of urban location. In Southeast Asia, for example, the estimated unmet contraceptive need is 23% among the urban poor, compared to only 16% among the urban non-poor.1
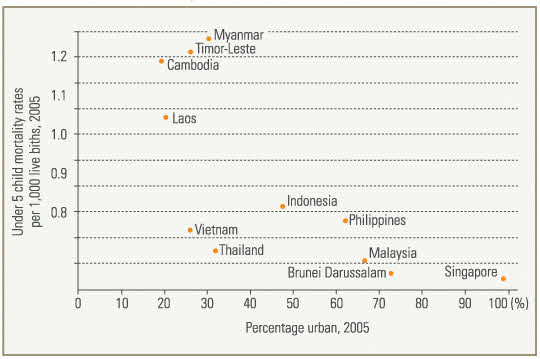
But, in general, urban populations tend to have better health outcomes than their rural counterparts. In countries where urbanisation levels are highest, child mortality levels are lowest (Figure 3). This is because access to health services, including clinics and hospitals, as well as the quality of care, tends to be superior in urban areas.
FIGURE 3. CHILD MORTALITY RATES AND PROPORTIOS URBAN, SOUTHEAST ASIAN COUNTRIES. (SOURCES OF DATA: UNITED NATIONS DEPARTMENT OF ECONOMIC AND SOCIAL AFFAIRS, WORLD URBANIZATION PROSPECTS: THE 2005 REVISION;5 UNITED NATIONS STATISTICS DIVISION12)
PARTICIPATORY URBAN GOVERNANCE
Urbanisation offers significant opportunities to improve human development and achieve the MDGs. Yet, the rapid and often unplanned growth of developing world cities of all sizes poses great challenges for attaining human development goals: these cities must expand the provision of essential infrastructure and services while ensuring that such expansion does not compromise existing living conditions or generate more air pollution.
For example, in Southeast Asian cities such as Bangkok, Kuala Lumpur, Manila and Jakarta, growth of urban traffic is creating serious levels of congestion and unprecedented levels of carbon emissions and pollution. Growing affluence has led to a high concentration of vehicles in Malaysian cities, especially Kuala Lumpur. This has resulted in carbon emissions increasing by 221% from 1990 to 2004, the highest rate of increase among the world’s top polluters.13 Some cities have implemented urban planning and greening policies aimed at significantly reducing private motorised transport and consequently air pollution.
Other countries have implemented major, long-term slum upgrading programmes. For example, Thailand has focused almost 30 years of attention on low-income housing. Most recently, the construction of 1 million low-income houses in partnership with commercial and public banks, has helped to cut the slum growth rate by an average of nearly 20% a year since 1990.6 In 1992, the Thai government created the Urban Community Development Office (UCDO), the largest community-driven programme for assisting the urban poor in the developing world. UCDO extends loans, grants and technical assistance to community organisations and encourages collective bargaining with city and provincial authorities.
How can cities best respond to the inevitability of growing populations and growing affluence? Improved urban governance will need to provide a large part of the answer.14 “Urban governance” denotes both government responsibility and civic engagement. Generally, it refers to the processes by which local urban governments—in partnership with other public agencies and different segments of civil society—respond effectively to local needs in a participatory, transparent and accountable manner. As urban growth continues, cities need long-term strategies for expected change. The planning horizons of good governance must extend beyond current needs.
In many developing countries, national governments are devolving some of their powers and revenue-raising authority to local governments. This opens up new opportunities for local governments to take a more active role in social and economic development.
Attention to human rights and the rise of civil society, along with movements towards democratisation and political pluralism, have also given local-level institutions more responsibility. In Indonesia, decentralisation laws, approved in 1999 and amended in 2004, assign local governments responsibilities for most public functions including service delivery. These reforms promote the development of a clear mandate for the funding and delivery of education, health services, and public works.15
Trends supporting localisation and decentralisation are significant because a large proportion of urban demographic growth is occurring in small cities of less than 1 million inhabitants. Local governments have the advantage of flexibility in making decisions on critical issues such as land use, infrastructure and services, and are more amenable to popular participation and political oversight. However, they need significant support from both the public and private sectors as they tend to be under-resourced, under-financed, and lack critical information and the technical capability to utilise it.
“Urban governance” refers to the processes by which local urban governments—in partnership with other public agencies and different segments of civil society—respond effectively to local needs in a participatory, transparent and accountable manner.
CONCLUSION
Continued sustained growth of the Southeast Asian economies and structural changes in the patterns of employment, from agriculture to modern sectors, will inevitably lead to higher levels of urbanisation. Further progress towards the achievement of the MDGs and high human development will require a stronger commitment to the principles of good governance, including upholding the rule of law; promoting human rights; and transparent, participatory, and accountable decision-making processes. It also requires pro-poor and gender sensitive policies to narrow rich-poor disparities.
City growth provides opportunities for modernisation and cultural enrichment, and accelerates social change. Rapidly growing cities, especially the larger ones, will include various generations of migrants, each with a diversity of social and cultural backgrounds. In a diverse global network of vibrant cities, there needs to be continual adjustment and adaptation to the mix of traditional values and contemporary perspectives of communities and governments.
ABOUT THE AUTHOR
Richard Leete is Director and Head of the Department of Social Affairs of the General Secretariat for Development, Government of Qatar. Dr Leete was formerly the Resident Representative of the United Nations Development Programme for Malaysia, Singapore and Brunei Darussalam, a position he held from October 2003 to April 2008, during which he concurrently served as the Resident Co-ordinator for the United Nations’ Operational Activities for Development in Malaysia, as well as UNFPA Representative. In June 2007, he was awarded the Darjah Kebesaran Panglima Jasa Negara (PJN) (Honorary) that carries the title “Datuk”.
NOTES
UNFPA, State of World Population 2007: Unleashing the Potential for Urban Growth (New York: United Nations Population Fund, 2007).
Brunei Darussalam: Millennium Development Goals and Beyond (Brunei Darussalam: Brunei Darussalam Department of Economic Planning and Development and UNDP, 2005).
Malaysia: Achieving the Millennium Development Goals: Successes and Challenges (Kuala Lumpur, Malaysia: Malaysian Economic Planning Unit and United Nations Country Team Malaysia, 2005).
Human development is the conceptual approach to development that goes beyond income. Conceptualised by the United Nations Development Programme, human development is a process of increasing people’s capabilities and widening choices. The ultimate aim is the realisation of human rights and human freedom.
United Nations, Department of Economic and Social Affairs, Population Division, World Urbanization Prospects: The 2005 Revision (New York: United Nations, 2006).
UN-Habitat, State of the World’s Cities 2006/7: the Millennium Goals and Urban Sustainability (London: United Nations Human Settlements Programme, Earthscan, 2006).
Leete, R., Malaysia: From Kampung to Twin Towers: 50 Years of Economic and Social Development (Selangor, Malaysia: Oxford Fajah, 2007).
A slum household comprises a group of individuals living under the same roof in an urban area who lack one or more of the following: durable housing; sufficient living area, access to improved water, access to sanitation, and secure tenure. As the focus of poverty shifts from rural areas to urban centres, the world’s one billion slum dwellers are more likely to die earlier, experience more hunger and disease, and attain less education and have fewer chances of employment than urban residents outside slums.
The Human Development Index (HDI) is a composite of three measurable dimensions of human development, viz. (i) to have the capacity to live a long and healthy life; (ii) to be educated and knowledgeable; and (iii) to have access to assets, decent employment and income.
UNDP (2007) Human Development Report 2007/2008: Fighting Climate Change: Human solidarity in a divided world, New York.
UNDP, Human Development Report 2006: Beyond Scarcity: Power, Poverty and the Global Water Crisis (New York, Palgrave Macmillan, 2006).
UNFPA, State of World Population 2007: Unleashing the Potential for Urban Growth, Appendix Table 1.1 (New York: United Nations Population Fund, 2007), p69.
United Nations Millennium Project, Investing in Development: A Practical Plan to Achieve the Millennium Development Goals (London and Sterling: Earthscan, 2005).
Asian Development Bank, Annual Report 2005 (Philippines: Asian Development Bank, 2005).
FURTHER READING
Legrain, Philippe, Immigrants: Your Country Needs Them (London, UK: Little, Brown, 2007).