
Phases of Singapores Demographic Development Post World War II
by Koh Eng Chuan
Last updated on 23 July 2026
ETHOS Issue 07, Jan 2010

INTRODUCTION
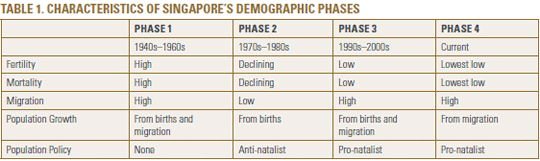
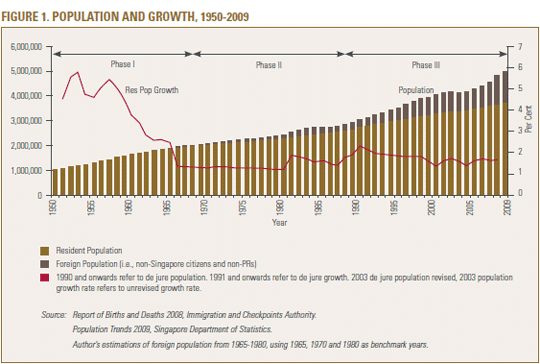
From a population of 1 million in 1950, Singapore's resident population, comprising citizens and permanent migrants, has grown more than three and a half times to 3.7 million in 2009 (5.0 million, if foreigners with permits1 are included). Singapore's demographic change from the late 1940s can be differentiated into three phases characterised by distinct population trends and socioeconomic developments, with a fourth phase now emerging.
Fertility had begun to fall even before the family planning measures were put in place.
FERTILITY DECLINE REGARDLESS OF POLICY
Throughout Singapore's various demographic phases, direct measures had been put in place to modify fertility behaviour. Some have contended that the anti-natalist policies carried out by the Singapore Family Planning and Population Board played an important role behind our sharply falling fertility,2,3 and some have noted that Singapore was seen as a "role model for government fertility control" programmes4 in the days when the global attention was on reducing fertility for the sake of sustainable development. Yet others have viewed Singapore as having "succeeded too well", with "unintended consequences".5 While selected individuals might have been influenced in their fertility decisions, it was more likely that government policies had acted as a catalyst in hastening a fertility transition which would have taken place even without direct intervention.
Three observations support this view. Firstly, fertility had begun to fall even before the family planning measures were put in place.6,7 Total Fertility Rate (TFR) had fallen from a peak of 6.56 in 1957 to 4.62 in 1965, before the government set up the Singapore Family Planning and Population Board in 1966. This suggests that even prior to Independence, women were already making a conscious decision to reduce fertility either through traditional family planning methods, or through the limited family planning services made available by the voluntary Singapore Family Planning Association.
Secondly, even with the reversal to a pro-natalist policy supporting childbearing from the late 1980s, fertility did not rise from its low levels. The socioeconomic case for having a small family had become so strong that despite three rounds of measures by the Government,8 fertility remained below 1.3 from 2003 to 2008. A well-educated population, ample job opportunities and expectations to work hard in a highly competitive environment had created strong forces making small families advantageous. Actualising any desire for a large family remained impractical for most.
Changes in the population, society and economy were already leading to a reduction in the number of children couples would have.
Thirdly, we observe that most low fertility societies around the world (for example, Spain, Italy, Germany, but also Hong Kong and Japan) did not have anti-natalist population policies to push fertility down. What most of these societies had in common were a well-educated population or a rapid rise in the education profile of women, increasing ages at marriage and childbearing, and an economy that had been successful in creating jobs for its people.9 Observers10,11 have noted that socioeconomic conditions could already have provided a favourable basis to the success of family planning programmes. While family planning policies are likely to have contributed to Singapore's pace of fertility decline, they are secondary to the fact that changes in the population, society and economy were already leading to a reduction in the number of children couples would have.
Lesthaeghe12 has suggested that the post-modernist values of industrialised countries have resulted in an environment favouring continued low fertility, leading such countries into a Second Demographic Transition.13 Lesthaeghe emphasises ideational changes—society and individuals influencing one another—that affect demographic behaviour related to the formation/dissolution of unions, marital/non-marital fertility behaviour; shifts towards individualism and self-fulfilment as higher order needs; and the formation of new societal norms. The role of men and women as economic agents in the commercial economy are not directly compatible with the role of mothers and fathers at home.14 With demands on limited time, trade-offs have to be made.
Singapore appears to have entered this Second Demographic Transition. With lifestyle changes, employment opportunities, economic progress and social development, couples have fewer children, no matter how much they desire children. Fertility is unlikely to rise now or in the future without some fundamental and large-scale changes.
A FOURTH PHASE: NET MIGRATION TAKING OVER NATURAL INCREASE AS THE MAIN SOURCE OF POPULATION GROWTH
Arising from a rapidly ageing population, continued low fertility and need for migrants,15 a fourth phase of Singapore's demographic development is emerging. A key characteristic of the fourth phase is that the main source of population growth in Singapore will shift more and more from natural increase to net migration.16 This is to be expected, as the Crude Death Rate is also likely to increase in the coming years as the baby boomers reach age 65 and above, and mortality starts to set in. Natural increase (i.e., births minus deaths) would fall towards zero with Singapore's below-replacement fertility, and migrant inflows will be needed to maintain population growth. The implications are discussed below.
Net migration will take over natural increase as the main source of population growth.
Addressing Lowest Low Fertility
Comparing attempts to address low fertility, one key difference between the experiences of East Asian countries and the Nordic countries, is the availability of comprehensive and quality state-provided childcare in the Nordic states. Arguments have already been made in Singapore to lower the formal age of education. As well as promoting early childhood educational development, this also reduces parents' burden in raising children and frees them to pursue careers, personal interests, and have more time with each other. One way to implement this is to take an opt-out approach, so that state-provided childcare becomes a societal norm rather than an exception. Opting-out also allows flexibility for some families who may prefer themselves or grandparents as primary caregivers.
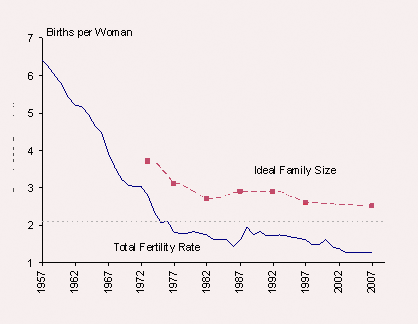
Moving towards comprehensive, accessible and quality childcare for all will take time and resources, and will require a full review of current pro-natalist incentives and initiatives. It is worth considering how else the state can help working parents to reduce the burden of childrearing, given that ideal family size is in fact much higher than total fertility rate.17
Immigration
In the third phase of demographic development, both permanent and temporary migration had been utilised to supplement the local population and workforce in the form of "replacement migration".18 This strategy will continue into the fourth phase, even if the inflow of foreign workers and immigrants is expected to be moderated.
Integration of migrants will be a key area of focus in the coming years,19 particularly if Singapore will have to depend more and more on migrants for population growth with natural increase declining. While it has been argued before that Singapore was a migrant society to begin with, it should be noted that there were communal goals among the diverse population at the time of Independence, and some sense of shared identity today after 44 years as a nation. This is an important difference from the migrants of today, who may be entering society without the same sense of shared communal values.20 Do they integrate and adapt; do they preserve their own immigrant identity and work within their enclaves; do they change the current shared values; do they enrich Singapore as a cultural melting pot—these are issues which need to be further reviewed.
Social and Age Structural Shift
The combined effect of low fertility and sustained migration will also mean that Singapore will undergo a huge age structure shift in the population. While this has been in the background for the third phase of demographic development, pronounced changes would only come after the post-war baby boomers reach age 65 years (Figure 2). The intake of permanent migrants in working ages from 1990 (third phase of demographic development) onwards will also start to reach age 65 from about year 2030, and will further raise the numbers of elderly in the population.
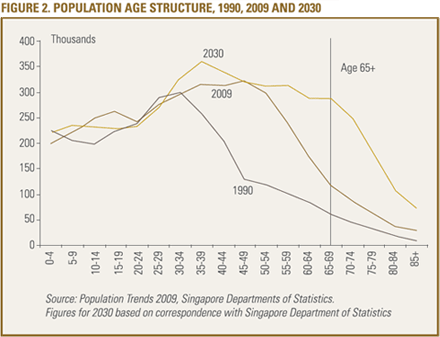
Permanent migrants in working ages from 1990 will start to reach age 65 from year 2030 and will further raise the numbers of elderly in the population.
With fertility below 1.3 and the new birth cohorts in the current 35,000 to 40,000 in the foreseeable future, the age structure imbalance will be accentuated. Singapore's dependency ratio will rise quickly in the near future, with the old dependency ratio overtaking the young dependency ratio in the future.
Singlehood proportions are high at about 13% to 15% for residents aged 40–44 years.21 Proportions of those with zero or one child among ever-married resident females are rising. In 2008, 8% of those aged 40–49 years have no children, while 18% have only one child. The large increase in the elderly and the low numbers of children in the local population will eventually cause strains at the family level and add pressure to current social structures. Single or widowed elderly without children or near kin may have difficulty even in engaging and managing domestic helpers to look after them. The State may have to be prepared to come in on a larger scale at some point.
RAISING FERTILITY IS THE MORE SUSTAINABLE SOLUTION
As with the other earlier phases, the fourth phase of demographic development in Singapore will bring new challenges to policymakers. Raising fertility would solve its own problems, and would be a more sustainable long-term solution. The Prime Minister announced additional procreation incentives during the National Day Rally in August 2008. While a large increase in fertility to 1.5 remains an optimistic target, it remains to be seen how much the population will respond to the additional procreation incentives, and whether further measures or social trade-offs will have to be made.
THREE PHASES OF DEMOGRAPHIC DEVELOPMENT
Phase I: High Fertility, Low Mortality, No Population Policy
The first phase of high population growth between 3% and 6% per annum lasted from the late 1940s to the mid-1960s. Mortality declined tremendously after the Second World War.
TABLE 1. BIRTHS AND TFR, SINGAPORE, 1947–2008
Year | Births | TFR | CDR (per 1,000 pop) | |
Phase I | 1947 | 43,045 | 6.55 | 13.3 |
1952 | 51,196 | 6.30 | 10.7 | |
1957 | 61,757 | 6.41 | 7.4 | |
1960 | 61,775 | 5.80 | 6.2 | |
1965 | 55,725 | 4.66 | 5.4 | |
Phase II | 1970 | 45,934 | 3.07 | 5.2 |
1975 | 39,948 | 2.07 | 5.1 | |
1980 | 40,100 | 1.82 | 4.9 | |
1985 | 41,100 | 1.61 | 4.9 | |
Phase III | 1990 | 49,787 | 1.83 | 4.7 |
1995 | 46,916 | 1.67 | 4.8 | |
2000 | 44,765 | 1.60 | 4.5 | |
2005 | 35,528 | 1.26 | 4.3 | |
2008 | 37,277 | 1.28 | 4.4 |
Source: Reports on Births and Deaths, Immigration and Checkpoints Authority. Population Trends, various years, Singapore Department of Statistics. NB: Resident figures from 1980 onwards. CDR: Crude death rate; TFR: Total fertility rate
Singapore also experienced a post-war baby boom, the impact of which was reinforced by rapidly increasing infant survival rates1. This lasted a period of about 15 years from the late 1940s to mid 1960s (Figure 1). According to Saw2, family planning arrangements then were inadequate for the task of spreading knowledge on the methods and availability of family planning instruments among the masses. However, there were already signs that fertility levels were already on a downward trend around the time of Independence.
Phase II: Low Fertility, Low Mortality, Anti-Natalist Population Policy
After a period of significant decline in CBR, Singapore experienced saw a gentler fall of the Crude Birth Rate (CBR) (Figure 1) during the second phase (1970s to mid-1980s). Crude Death Rate (CDR) was low at around 5 per 1,000 population. Life expectancy further increased and infant mortality fell. Singapore's population growth was stable, ranging from 1.3% to 1.9% per annum.
FIGURE 1. CRUDE BIRTH RATE AND CRUDE DEATH RATE, 1950–2008
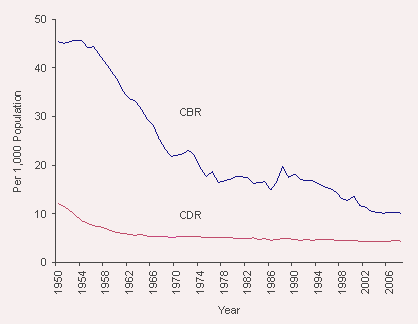
Source: Reports on Births and Deaths, Immigration and Checkpoints Authority.
This demographic development took place at the same time as newly independent Singapore was striving to provide for a sizeable young uneducated population and ensure sustainable economic growth. With the Government trying to manage population growth in line with economic resources, migrant inflow was kept to a minimum.
Despite falling fertility therefore, family planning services was introduced and measures were implemented to reduce the rate of population increase3. Population policies and family planning services were set in the broader context of managing the rate of population increase to reach the level that Singapore could cope with in terms of infrastructure, education and employment4. At the same time, the widespread availability of modern contraceptive methods made rational control of fertility possible5.
This second phase saw fertility falling below the ideal family size and also below replacement level (Figure 2). TFR thereafter remained below ideal family size, with the gap gradually widening in the third phase of demographic development.
FIGURE 2. TOTAL FERTILITY RATE AND IDEAL FAMILY SIZE
Source: Reports on Births and Deaths, Immigration and Checkpoints Authority.
Ideal Family Size: Yap, M. T., "Population Policies and Programs in Singapore" in Population Policies and Programs in East Asia, ed. Andrew Mason (Hawaii: East-West Centre, 2001). Ideal Family Size 2007: author's survey results based on 754 respondents aged 25–39 years.
In 1975, fertility reached replacement level for the first time. Subsequently, sustained low fertility soon forced Singapore to re-examine its family planning and population policies.
Phase III: Continued Low Fertility, Low Mortality but High Migration, Pro-Natalist Population Policy
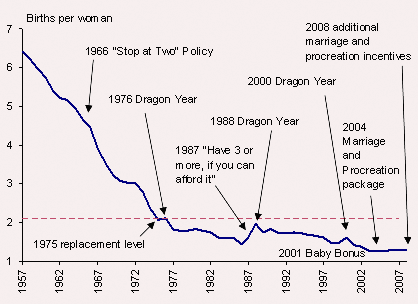
When fertility fell to a then historic low of 1.4 in 1986, the Government decided to completely and fully reverse its two-child policy, thus beginning a third phase in Singapore's demographic development. The focus was on getting the people to recognise that there were repercussions from sustained sub-replacement fertility levels since 19756. The tagline in the late 1980s promoted "Have Three or More if You Can Afford It". By then, sub-replacement fertility levels had been around for just over 10 years.
Pro-natalist measures were set in place in 1987 with the hope of countering the strong downward pull on fertility7. A slight rise in TFR to around 1.8–1.9 was experienced in the initial years following the new policy (Figure 3). This was short-lived, and fertility and births continued the general downward trend, despite additional incentives in 2001 and 20048.
FIGURE 3. TFR AND POPULATION POLICIES
Source: Population Trends, various years, Singapore Department of Statistics. Ministry of Community Development, Youth and Sports.
Recognising that the local population could not be depended on for generational replacement, encouraging more migrants to Singapore was a natural policy option9. Table 2 shows that in the 1950s prior to independence, net migration was substantial; it supplemented the high rates of natural increase to produce extraordinarily high rates of population growth from 1947 to 1957. Only in the second phase of demographic development was migration turned off. In the third phase starting from the late 1980s, migration again became an important component of population growth. These were permanent settlers who had applied for long term residence with a view to stay, live and work in Singapore, akin to the early migrants10. By 2009, permanent residents accounted for approximately 11% of the total population.
TABLE 2. COMPONENTS OF RESIDENT POPULATION GROWTH, SINGAPORE, 1947–2008
Phase | Year | Resident Population\* | Inter-period | |
Natural Increase | Net Migration | |||
I | 1947 | 938,100 | - | - |
1957 | 1,445,900 | 395,300 | 112,500 | |
1965 | 1,886,900 | 397,000 | 44,000 | |
II | 1970 | 2,013,600 | 190,000 | -63,000 |
1975 | 2,147,900 | 170,000 | -36,000 | |
1980 | 2,282,100 | 142,000 | -8,000 | |
1985 | 2,482,600 | 144,000 | 57,000 | |
III | 1990 | 2,735,900 | 166,000 | 87,000 |
1995 | 3,013,500 | 174,000 | 104,000 | |
2000 | 3,273,400 | 152,000 | 108,000 | |
2008 | 3,642,700 | 181,900 | 187,400 | |
\* Resident population from 1970; 1975 estimated. Source: Author's computations of estimates based on Saw S. H.1 and Reports on Births and Deaths, various years, Immigration and Checkpoints Authority.
TABLE 3. SINGAPORE'S POPULATION COMPOSITION, 1970–2009
Total Population | Citizens | Permanent Residents | Foreigners | |
('000) | Percent | |||
1970 | 2,074.5 | 90.4 | 6.7 | 2.9 |
1980 | 2,413.9 | 90.9 | 3.6 | 5.5 |
1990 | 3,047.1 | 86.1 | 3.7 | 10.2 |
2000 | 4,027.9 | 74.1 | 7.1 | 18.7 |
2009 | 4,987.6 | 64.2 | 10.7 | 25.1 |
Source: Censuses of Population, General Household Survey, Population Trends 2009, Singapore, Department of Statistics Singapore also saw population growth coming from foreigners with permits to work and live here for a specified period of time (Table 3). In the third phase of demographic development during 1987–2009, foreigner growth more than tripled that of 1970–1987 (Table 4). They were a complementary source of manpower in addition to the locals as Singapore's economy grew. By 2009, the foreign population had grown to over one million. From 8% of the total population in 1987, its share had increased to 25% in 2009.
TABLE 4. FOREIGN POPULATION GROWTH, SINGAPORE, 1970–2009
Year | Number | Inter-Period Growth |
1970 | 60,900 | - |
1987 | 220,900 | 160,000 |
2009 | 1,253,700 | 1,032,800 |
Source: Population Trends 2009, Singapore Department of Statistics
Notes
Saw, S. H. Singapore Population in Transition (Philadelphia: University of Pennsylvania Press, 1970).
Saw, S. H. Changes in the Fertility Policy of Singapore (Singapore: Institute of Policy Studies and Times Academic Press, 1990): 1-2.
Saw, S. H. Population Control for Zero Growth in Singapore (UK: Oxford University Press, 1980): 53.
The Singapore Family Planning and Population Board formed in 1966 promoted measures ranging from those affecting key intermediate determinants of fertility such as abortion, sterilisation, and usefulness of and access to family planning methods, to those influencing socioeconomic factors such as cost of delivery fees, limitations of maternity benefits, taxation, housing benefits, and education. See Chen, P. S. J. and Fawcett, J. T. Public Policy and Population Change in Singapore (New York, The Population Council, 1979).
Easterlin, R. A. and Crimmins, E. The Fertility Revolution: A Supply-Demand Analysis (Chicago: The University of Chicago Press, 1985).
Goh, C. T. The Second Long March. Speech delivered at the Nanyang Technological Institute, 4 August 1986. http://stars.nhb.gov.sg/stars/public/, accessed 8 December 2007.
Yeoh, B. and Wong, T. "An Overview of Pro-natalist Population Policies in Singapore." Asian Metacentre Research Paper Series No. 12, 2003.
Thang, L. L. "Private Matters, Public Concern: Procreation Issues in Singapore." The Japanese Journal of Population 3 (2005): 76-108.
Home Affairs Minister Wong Kan Seng emphasised this position in 2004 when he became the Minister-in-Charge of Population Issues, stating that "having more babies and bringing in more foreigners and making them citizens, are \[therefore\] complementary" approaches to building a competitive economy and a vibrant society. \[Wong K S 2004. Responses to Media Queries on Population Issues. Ministry of Home Affairs, 3 September 2004 https://www.mha.gov.sg/ (opens in new tab), accessed 28 Nov 09.
Yeo, G. "Building a Silicon Valley in Singapore." Business Week, 19 June 2000.
ABOUT THE AUTHOR
Dr Koh Eng Chuan is Director of the Income, Expenditure and Population Statistics Division in the Department of Statistics, Ministry of Trade and Industry. He has a PhD in Demography from the Australian National University. His areas of interest are in marriage and fertility studies, as well as population trends and movements. He is also a visiting affiliate of the Asia Research Institute, National University of Singapore. The views expressed in this article are his own.
NOTES
Includes temporary professional and skilled workers, domestic workers, foreign students and social visitors with permits who stay for certain periods of time.
Wan, F. K. and Saw, S. H. "Knowledge, Attitudes and Practice of Family Planning in Singapore." Studies in Family Planning 6 (1975):109-112.
Yap, M. T. "Fertility and Population Policy: The Singapore Experience." Journal of Population and Social Security (Population), Supplement to Volume 1 (2003): 643- 658.
Lee, S. M., et al. "Fertility Decline and Pronatalist Policy in Singapore." International Family Planning Perspectives 17 (1991): 65-69+73
Anderson, B. "Unintended Population Consequences of Policies." Population and Environment 25 (2004): 377- 390.
Chang, C. T. Fertility Transition in Singapore (Singapore: Singapore University Press, 1974).
Fawcett, J. T. and Khoo, S E. "Singapore: Rapid Fertility Transition in a Compact Society." Population and Development Review 6 (1980): 549-579.
Including tax reliefs and rebates, baby bonuses, paternity leave, increases in childcare places and subsidies, paid maternity leave for the third child, increases in the length of maternity leave, etc. in 1987, 2001 and 2004.
Atoh, M., et al. "The Second Demographic Transition in Asia? Comparative Analysis of the Low Fertility Situation in East and South-East Asian Countries." The Japanese Journal of Population 2 (2004): 42-75.
Fawcett and Khoo (1980), and similarly Atoh, et al. (2004:47).
Ridker, R. G. "Desired Family Size and the Efficacy of Current Family Planning Programmes." Population Studies 23 (1969): 279-284.
Lesthaeghe, R. "The Second Demographic Transition in Western Countries: an Interpretation," in Gender and Family Change in Industrialised Countries, eds. K. Mason and A. Jensen (UK: Oxford Clarendon Press, 1995): 17-62.
Van de Kaa, D. J. "Europe's Second Demographic Transition." Population Bulletin 42 (1987): 1–57.
McDonald, P. "Theories Pertaining to Low Fertility." International Union for the Scientific Study of Population Working Group on Low Fertility. Tokyo, 21-23 March 2001.
Wong, K. S. "DPM's Speech at the Committee of Supply. Prime Minister's Office, Sep 2004. https://www.mha.gov.sg/, accessed 28 November 2009.
In the period 2000-2008, Net Migration (187,400) balanced Natural Increase (181,900). In the near future, net migration would take over natural increase as the main source of population growth. Author's computations of estimates based on Saw, S. H. Singapore Population in Transition (Philadelphia: University of Pennsylvania Press, 1970) and Reports on Births and Deaths, various years, Immigration and Checkpoints Authority.
Sources: Reports on Births and Deaths, Immigration and Checkpoints Authority. Reference to "Ideal Family Size" from Yap, M.T., "Population Policies and Programs in Singapore" in Population Policies and Programs in East Asia, ed. Andrew Mason (Hawaii: East-West Centre, 2001); reference to "Ideal Family Size 2007" based author's survey results based on 754 respondents aged 25 to 39 years.
United Nations Population Division. Replacement Migration: Is It a Solution to Declining and Ageing Populations? (New York: UNDP, 2000).
Ministry of Community Development, Youth and Sports (MCYS). National Integration Council to Foster Social Integration. https://www.mccy.gov.sg/ (opens in new tab), accessed 31 August 2009.
Yeoh noted that social integration concerns may arise from differences within racial categories as it becomes "inflected by differences in nationality and history". For example, the Chinese community now is not going to be the same as the Chinese community a generation later with the migrants coming in. Yeoh, B. "Migration, International Labour and Multicultural Policies in Singapore." Asia Research Institute Working Paper No 19. February 2004. https://ari.nus.edu.sg/ (opens in new tab)
Singapore Department of Statistics 2009. Population Trends 2009. https://www.singstat.gov.sg/ (opens in new tab), accessed 30 November 2009.