
Green Transport in Singapore: Public Attitudes, Intentions and Actions
by Chong Wen Wei, Leong Wai Yan, Karenza Mosquera, Ng Kai Xuan and Ng Sheng Yang
Last updated on 20 July 2026
ETHOS Issue 24, August 2022

INTRODUCTION
The scientific consensus is that global climate change resulting from the emission of greenhouse gases in the modern industrial era has had far-ranging environmental and health consequences worldwide.1 Although Singapore is not a major greenhouse gas producer, contributing only 0.1% of global carbon emissions, we nevertheless are making significant domestic efforts towards net zero emissions by or around the middle of the century, which align with our international obligations, such as the Paris Agreement, to help limit global warming to 1.5°C above pre-industrial levels.
With transport being Singapore’s third largest CO2-equivalent emitter, at about 16% of total emissions,2 aggressive efforts are being made under the SG Green Plan 20303 to (a) ‘green’ public transport fleets, (b) increase public transport peak-period modal share, (c) encourage active mobility modes, and (d) promote cleaner vehicles, culminating in a recently announced pledge to cut 80% of peak land transport emissions by or around middle of the century.4
Travelling by an electric car (EV), electric bus or train cuts carbon emissions by 50%, 70%, and 90% respectively, compared to driving an internal combustion engine (ICE) car.
REDUCING SINGAPORE’S LAND TRANSPORT CARBON FOOTPRINT
Travelling by an electric car (EV), electric bus or train cuts carbon emissions by 50%, 70%, and 90% respectively, compared to driving an internal combustion engine (ICE) car.1 Additionally, the carbon footprint for active modes (e.g., walking or cycling) is practically zero. To make significant cuts in the land transport carbon footprint, Singapore needs to strongly promote the use of active mobility (AM) and public transport (PT) even as we continue to green our land transport fleets and infrastructure.
To encourage active commutes, the Government is investing heavily in the nation’s AM infrastructure. For example, the Islandwide Cycling Network programme plans to increase our cycling network to more than 1300 km by 2030. Efforts are also well underway to repurpose existing road space that enhance safety and connectivity for walking and cycling.
To complement existing AM infrastructure, the Government is also ensuring that PT remains a green and attractive choice. The Land Transport Authority (LTA) has committed to having all public bus fleets run on cleaner energy by 2040, with half of these buses to be electric by 2030. Energy saving features are also being progressively introduced into PT infrastructure. LTA intends to expand the country’s rail network from 230 km to 360 km over the next 15 years to increase its accessibility, reducing the need for private transport.2 The ambition is that by 2040, 9 in 10 peak period trips will be made on ‘Walk, Cycle, Ride’ modes, with most of these trips made via active modes or PT.
While private vehicles are generally not as green as PT, their carbon footprint can still be reduced if ICEs are replaced with EVs that have zero tailpipe emissions. Hence, encouraging EV adoption is another important strategy, underlined by recently announced initiatives such as (a) upgrading existing electrical infrastructure to support wider usage of residential charging networks, (b) installing EV chargers in public housing carparks over the next few years, and (c) continuously reviewing new policies and regulations to ensure the safety and reliability of EV charging. These initiatives complement existing policies that regulate vehicle ownership and usage by further lowering the baseline rate of road vehicle emissions.
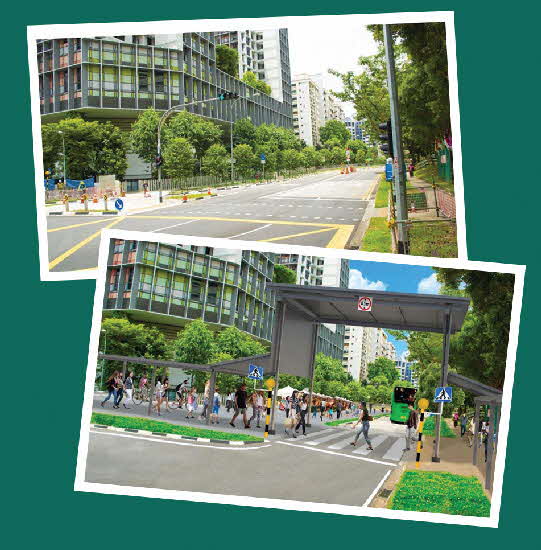
"Before" and "After" artist impressions of the road repurposing of Woodlands Ring Road conducted in August 2021
Source: Land Transport Authority Singapore
Notes
Ministry of Transport, “Speech by Minister for Transport, Mr S Iswaran at the Committee of Supply Joint Segment on Singapore Green Plan 2030”, accessed May 3, 2022, https://www.mot.gov.sg/news/in-parliament/Details/speech-by-minister-for-transport-mr-s-iswaranat-the-committee-of-supply-joint-segment-onsingapore-green-plan-2030 (opens in new tab).
Land Transport Authority, “Growing Singapore’s Land Transport Network”, accessed accessed May 3, 2022, https://www.lta.gov.sg/content/ltagov/en.html (opens in new tab).
We Need Singaporeans on Board
Even as LTA introduces bold initiatives to reduce the carbon footprint of our land transport system, we cannot achieve our vision without public support and buy-in. Hence, as we push on with this sustainable journey, we need to know what Singaporeans think about these efforts and whether they are supportive of the Government’s new policies.
Crucially, we also need to understand the different profiles of aspirations and needs in our population and how we might cater to them.
Three recent studies we have worked on offer glimpses into how our citizens think and feel about greener transport, highlighting the opportunities and pitfalls that policymakers should keep in mind when planning for effective change.
PUBLIC WILLINGNESS TO EMBRACE GREENER TRANSPORT OPTIONS
The first study, the Sustainable Behaviours and Perceptions Survey (SBPS), was carried out with some 600 car owners and non-owners, in collaboration with the National University of Singapore (NUS) in December 2021.5 SBPS aimed to compare car owners against non-car owners along several self-reported dimensions pertaining to the adoption and prioritisation of carbon-saving activities across various domains such as transport, food and energy.
Our second study, titled Green Commuting among Youths (GCY), was a nationally representative survey conducted by LTA in March 2022 using OPPi, an online AI-powered opinion crowdsourcing and engagement tool. Respondents were shown various opinion statements about environmental views and car ownership aspirations where they could respond with either “Yes”, “No”, or “Undecided”. We sampled around 600 youths between the ages of 18 and 31.
Finally, the EV Adoption Study (EVAS) was a survey conducted in collaboration with the Ministry of Communications and Information in January 2022 to understand receptivity towards EVs, including EV purchase intentions. The survey received around 1,000 responses from vehicle owners and prospective vehicle buyers in Singapore.
Both car and non-car owners equally acknowledge that reducing car use should be a key priority.
1. SBPS: CAR OWNERS VERSUS NON-CAR OWNERS
Environmental Priority
As we push towards a greener future for Singapore, the SBPS suggests that both car and non-car owners equally acknowledge that reducing car use should be a key priority.
In the survey, both car and non-car owners are asked to rank nine different environmental behaviours (see Figure 1)—with varying levels of carbon-saving impact, to be promoted in Singapore to mitigate climate change—from 1 (lowest priority) to 10 (highest priority). They also report their level of adoption for each of these behaviours in their dayto- day life on a scale of 1 (not at the moment) to 7 (always).
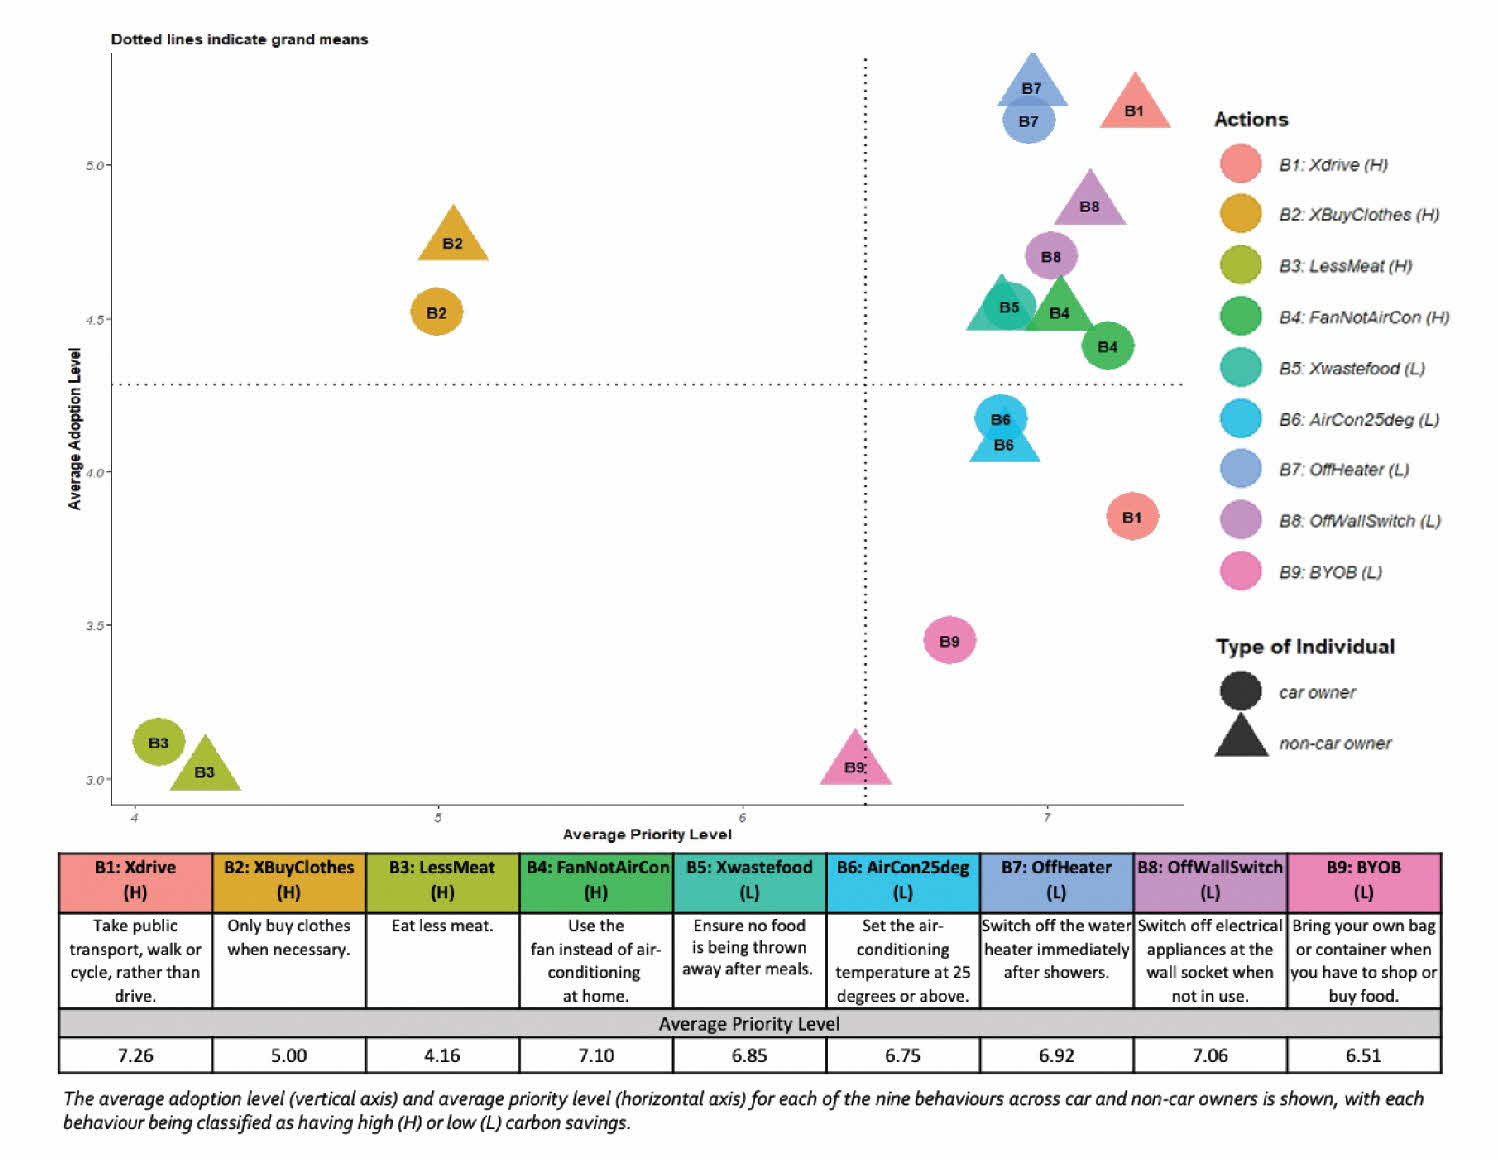
Figure 1. Adoption Levels against Perceived Priority of Environmental Actions
Among these surveyed behaviours, “Take PT, walk or cycle, rather than drive” (Xdrive) rank the highest overall in terms of perceived priority level for both groups. The carbon savings from not driving the car add up very quickly compared to the other eight behaviours, and thus we may also infer that Singaporeans have correctly identified the top environmental behaviour to prioritise.
This heartening result suggests that both car and non-car owners recognise the vital importance of LTA’s car-lite vision in realising a more sustainable future for Singapore, and we can leverage this unifying theme of mitigating climate change to rally more people to adopt car-lite lifestyles.
Loyalty to Cars
Unsurprisingly, car owners have a fairly low adoption level of Xdrive as shown in Figure 1, but even so, there is significant heterogeneity in the intention of car owners to switch to non-car alternatives. Not every car owner is captive to their car.
We reach this conclusion by analysing how car owners classify themselves into five different stages of reducing car use (see Figure 2).6 The stages range from having no reason or intention to reduce car use (stage 1) to having taken some action towards reducing car use (stage 5).
Encouragingly, 59% of car owners report being in stages 3 to 5: meaning that minimally, they had some intention to reduce car use and did not write it off as impossible. However, we find a sizeable proportion (40%) of car owners classifying themselves into stages 3 and 4. These car owners are experiencing an intention-action gap whereby they want to reduce car use but have not yet acted on their intentions.
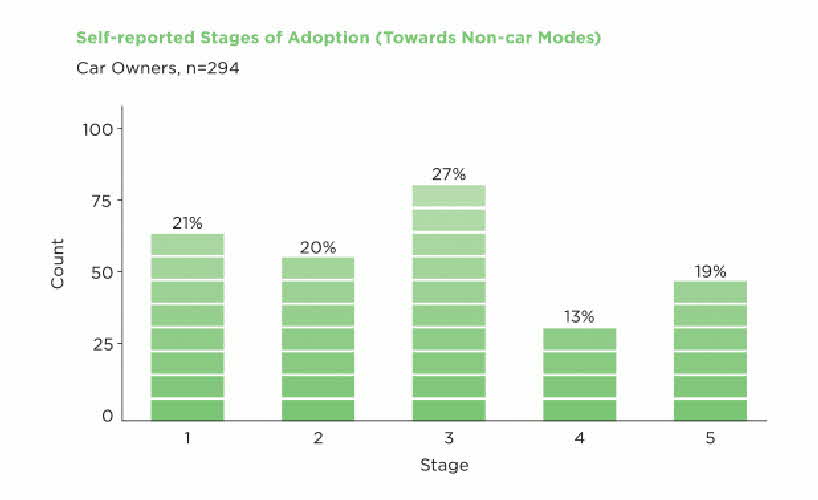
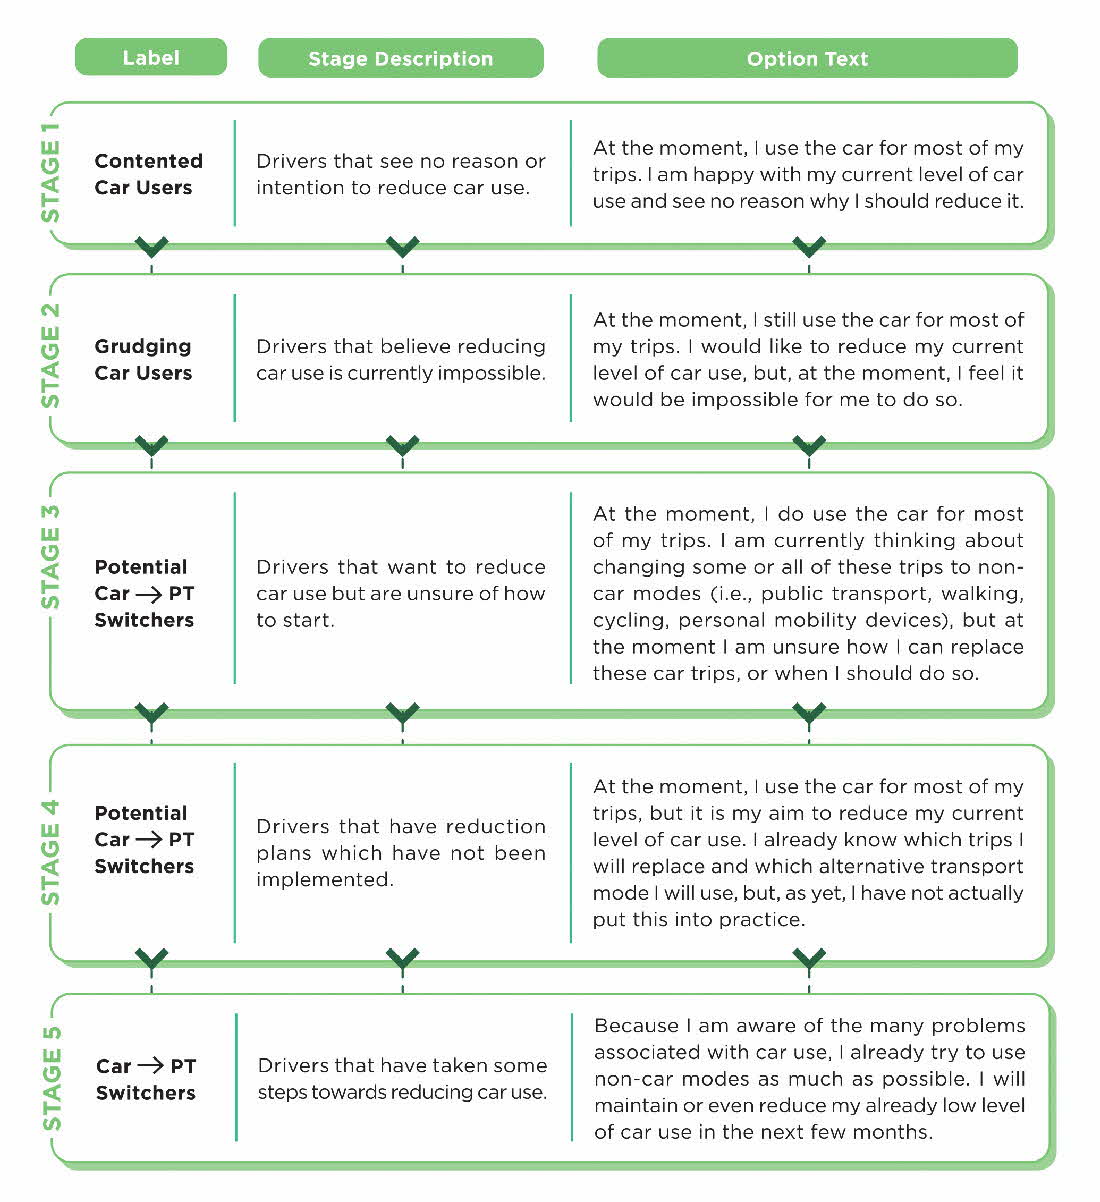
Figure 2. Stages of Adoption of Non-Car Modes among Car Owners
Loyalty to Public Transport
On the other hand, how worried should we be about non-car owners switching towards car dependency? We extend the five-stage model originally designed for car owners to assess how non-car owners classify themselves into different stages of private transport adoption (see Figure 3).
The encouraging news is that in contrast to car owners, non-car owners are more homogeneous in their intentions to stick with their current mode, with a majority (66%) who report being "contented PT users" (stage 1), in contrast to just 21% of car owners who say they are “contented car users”.
One group that bears closer monitoring are the 18% of non-car owners who are "grudging captives" (stage 2). Like stages 3 to 5, they aspire to own cars but unlike them, they feel trapped by circumstances to use PT. While there are a myriad of reasons why cars remain more desirable than PT, policymakers can find ways to cushion unmet expectations, shift preferences and transform grudging PT users into contented, voluntary users of public transport.
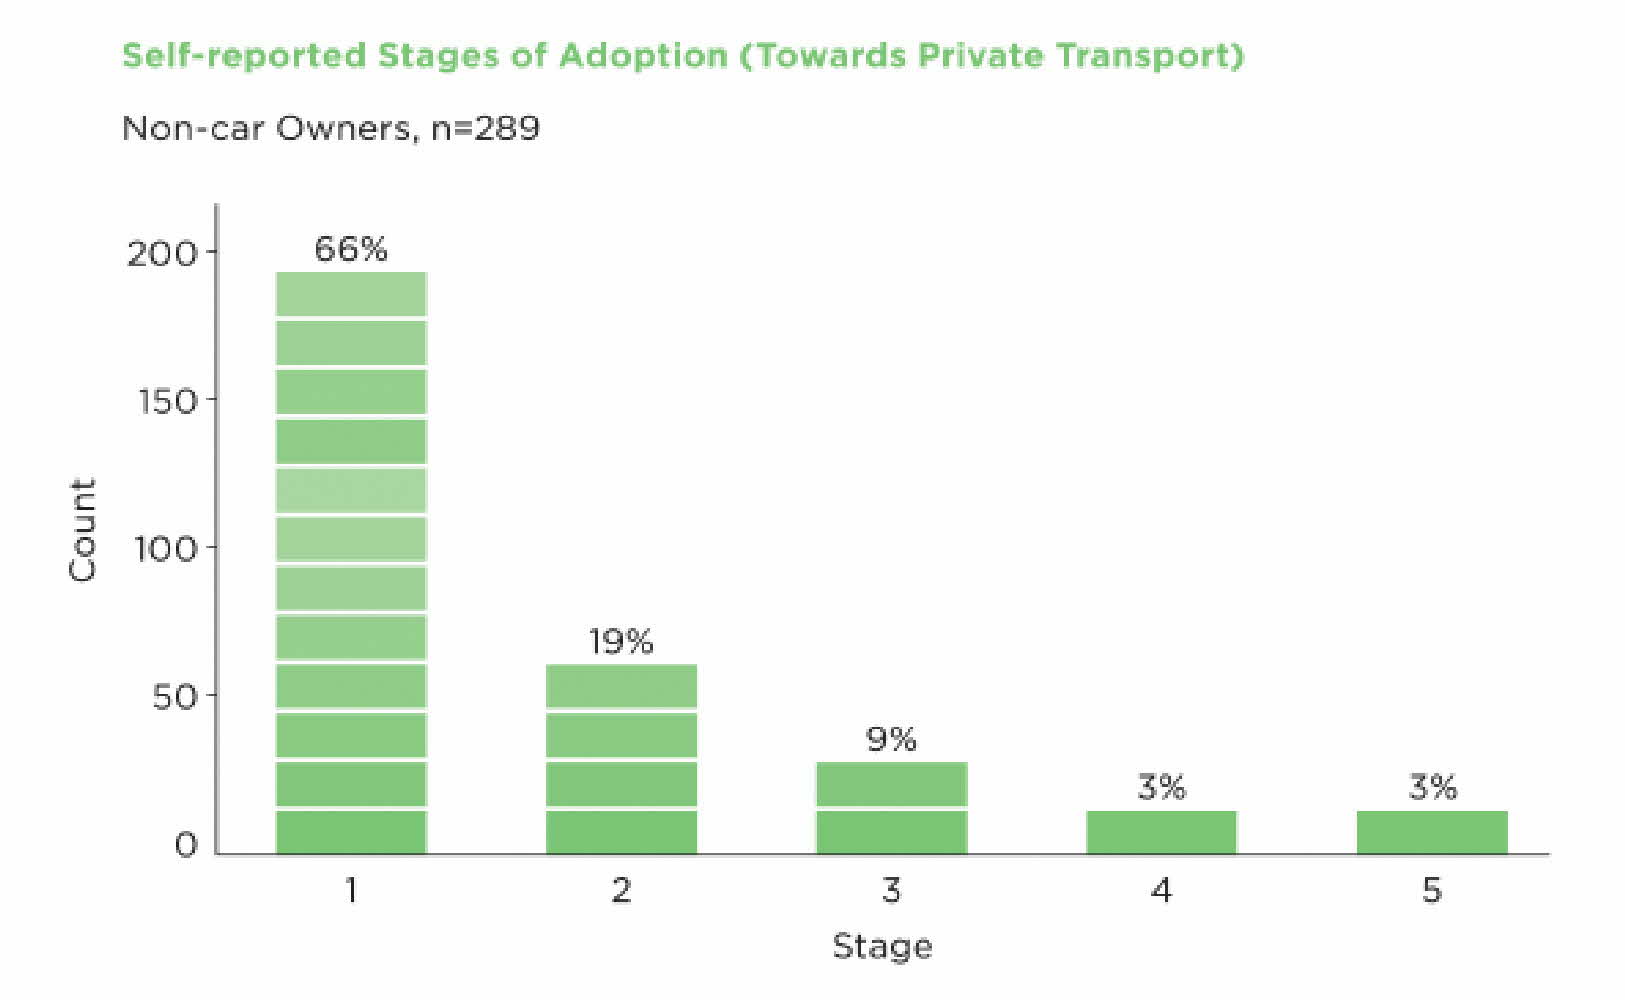
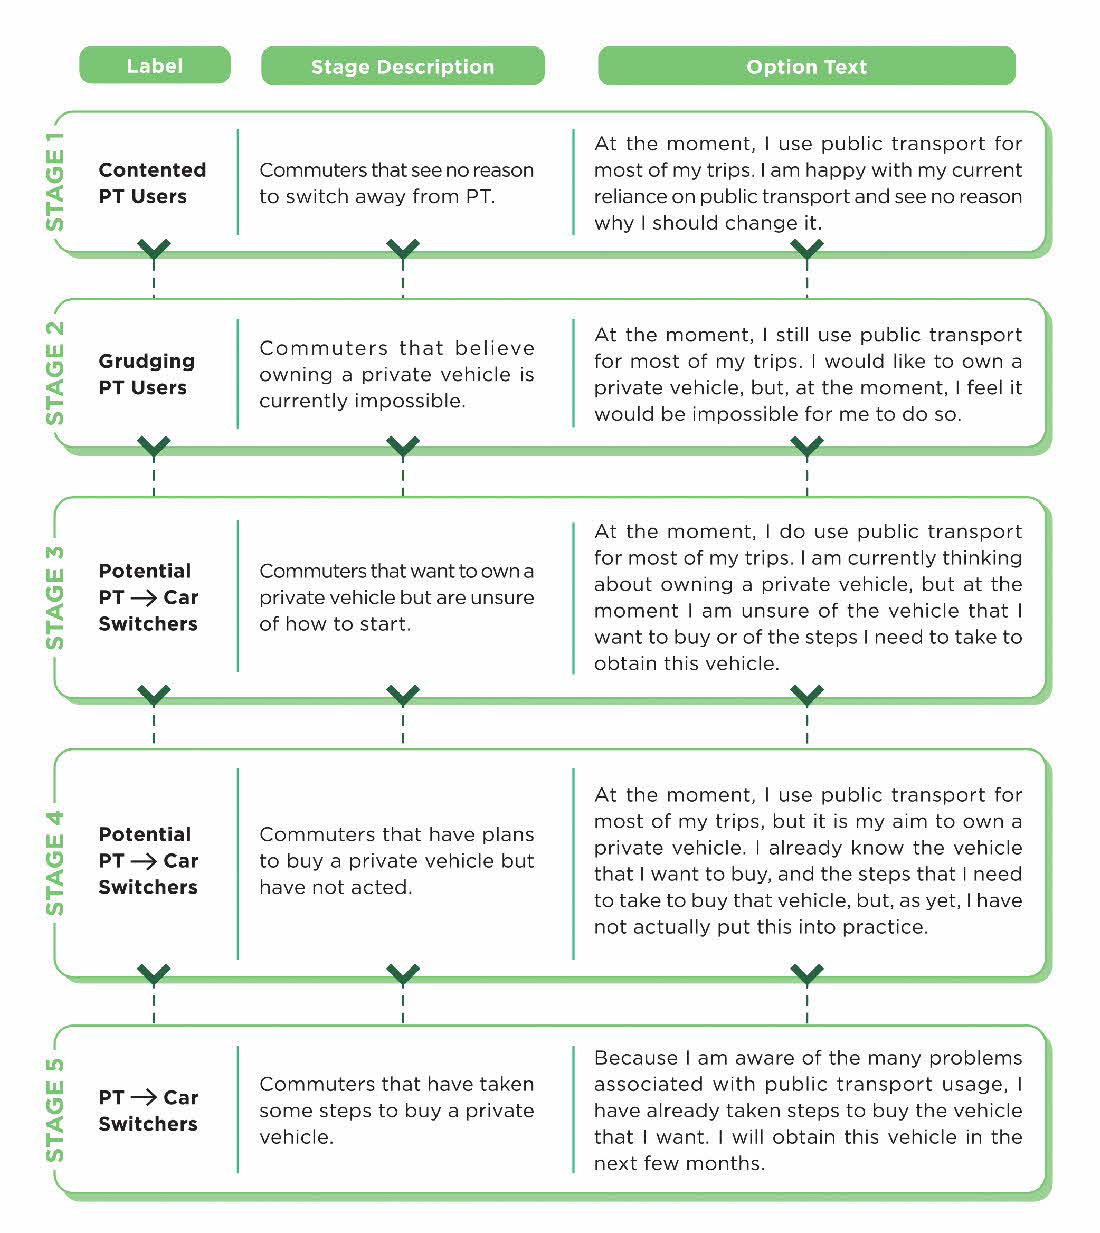
Figure 3. Stages of Adoption of Private Transport among Non-Car Owners
Policymakers can find ways to cushion unmet expectations, shift preferences and transform grudging users into contented, voluntary users of public transport.
2. GCY: ASPIRATIONS OF YOUNG NON-VEHICLE OWNERS
Among the non-car owners of today, it is important to take the pulse of what youths think of car ownership and relatedly, their environmental attitudes, as some of them will desire cars in the future as they form families and progress in their careers. A study such as the GCY will help address this question.
Declining Car Ownership Aspirations and Rates among Youths
From the GCY study, half of the respondents (47%) say that they plan to own a car before they turn 35 years old (see Figure 4). While cars have attractive instrumental benefits (e.g., privacy, ease of travelling), most agreed that alternatives such as ride sharing services are adequate substitutes for instances when PT does not meet their travel needs. These findings corroborate with SBPS findings that most non-car owners are happily captive to PT.
It is further significant that youth opinion is mixed on the symbolic value of car ownership, since this cultural attitude contributes to the inelastic demand of cars in a way that is difficult for public policy to resolve.
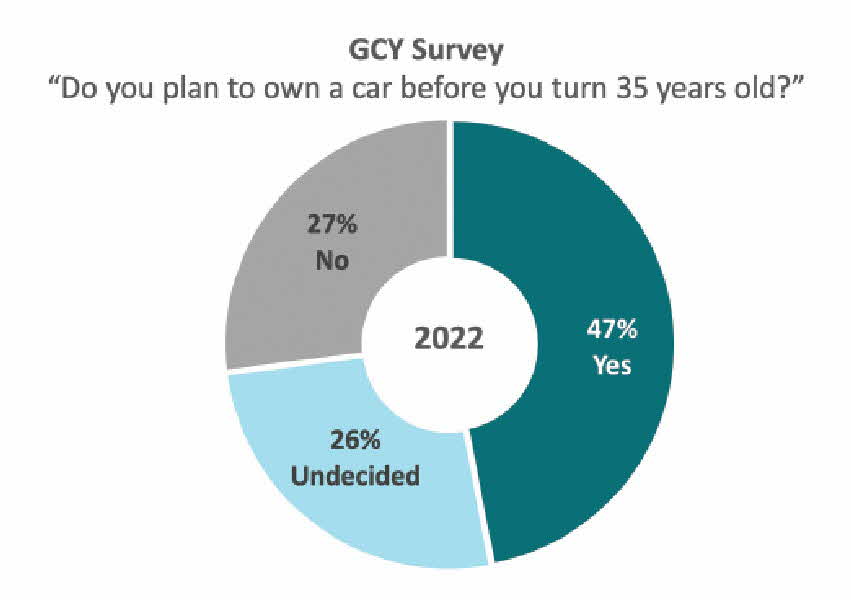
Figure 4. Car Ownership Aspirations among Youths from GCY Survey
This result corroborates with the survey conducted by The Straits Times which also finds that around 50% of today’s youths aspire to own a car. Although an analogous GCY study from previous years is not available, we may reference another finding from The Straits Times survey that car ownership aspirations among youths have been declining between 2016 and 2022. This insight syncs with an internal LTA study in 2020 which finds a falling trend in car ownership rates among young adults (see Figure 5), despite the car population remaining relatively stable in the same period.
What might explain this diminishing desire for car ownership? From the GCY study, we find that most youths see cars as a nice-to-have, but not a must-have (see Figure 6). Although the instrumental benefits of cars (e.g., privacy, ease of travelling) are readily apparent, most also agree that alternatives such as ride-sharing services are adequate substitutes for instances when PT does not meet their travel needs and that they would be able to live the life they want even without a car. These findings corroborate with SBPS findings that many non-car owners are contented PT users, suggesting that efforts to invest in and promote PT are bearing fruit.
We further find that youth opinion is mixed on the symbolic value of car ownership (see Figure 6). Likewise, The Straits Times study also picks up a decline in the status symbol of a car. This is significant since this cultural attitude contributes to the inelastic demand of cars in a way that is difficult for public policy to influence.
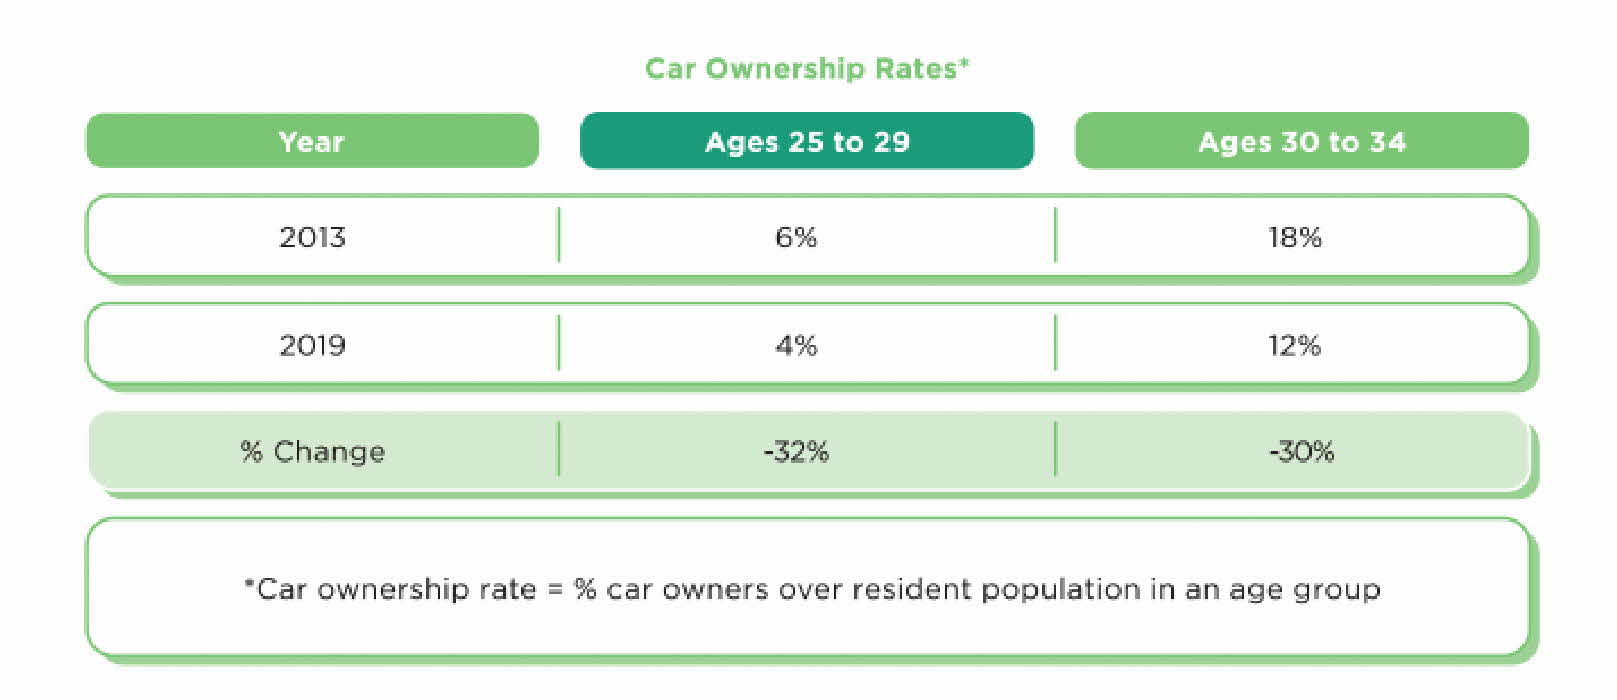
Figure 5. Car Ownership Rates among Singapore Youths
While we remain optimistic about current trends, we note that youths are not outright rejecting car ownership. Around half still plan to own a car and in response to another question in the GCY, some 70% indicate they would buy a car if they could afford one in the next 10 to 15 years. This serves to remind us that we must always persist in efforts to ensure the availability of good carlite transport alternatives to the car, so that we continue to keep more of our PT users in the “contented” category.
We must persist in efforts to ensure the availability of good car-lite transport alternatives to the car.
Environmental Attitudes towards Private and Public Transport
What about environmental attitudes among youths? There is consensus about the environmental harms of driving, but interestingly, not everyone perceives the same degree of environmental impact from their personal travel mode choice (see Figure 7). While most youths believe that cars are one of the biggest contributors to carbon emissions, they also appear divided on whether transport decisions (e.g., choosing to drive a car or taking PT) make a difference in protecting our climate, or whether it necessarily reflects one’s environmental values or their concern for the environment. On the question of whether they are the type of person who acts in environmentally friendly ways, 67% of car aspirants agree with the statement, compared to only 53% of non-aspirants, which seems like a paradox.
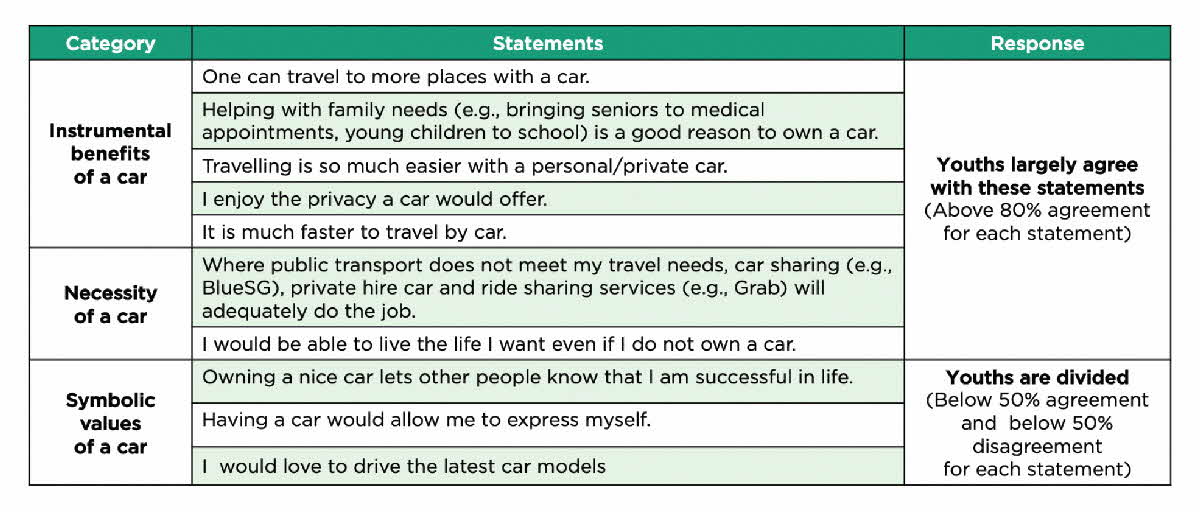
Figure 6. Summary of General Attitudes among Youths in GCY Survey
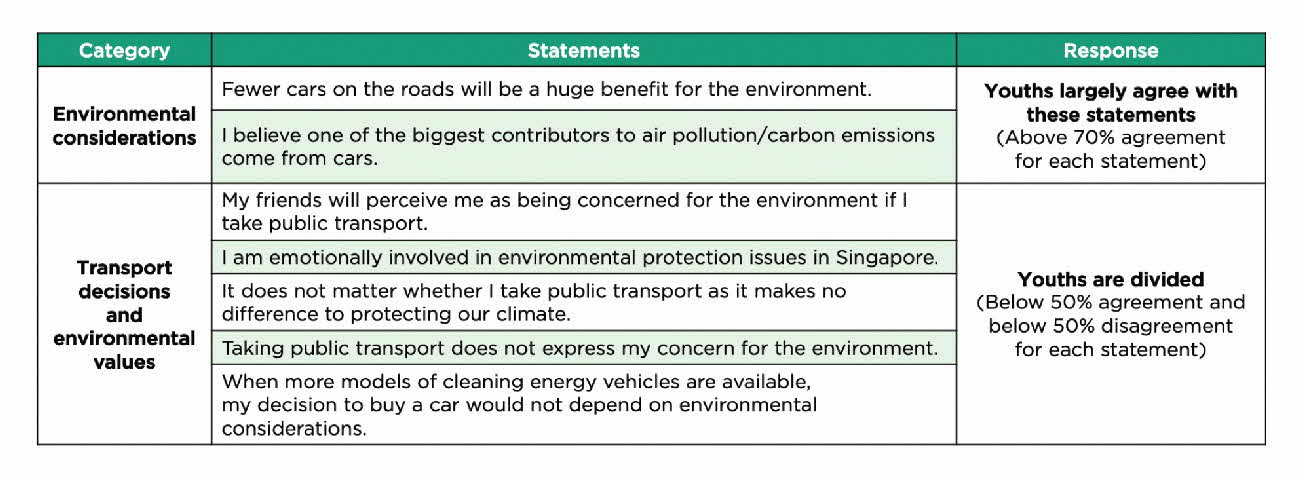
Figure 7. Summary of Environmental Attitudes among Youths from GCY Survey
Beyond building up our collective understanding of the environmental harm of driving, it is timely to begin imbuing a sense that every individual action matters.
We speculate that this paradox could have arisen due to pre-existing environmental tendencies being overshadowed by an overwhelming functional need for car ownership. It may also be a case of cognitive dissonance—a discomfort that arises when one’s awareness of the negative environmental impact of driving clashes with one’s personal desire for a car. Hence, those with stronger car aspirations may attempt to justify their personal desire for a car by claiming to behave (or even behaving) in a more environmentally friendly way in other domains, akin to a licensing effect.
Regardless, these findings suggest that beyond building up our collective understanding of the environmental harm of driving, it is timely to beginimbuing a sense that every individual action matters. Among all our lifestyle actions, one of the best things we can do for the environment, that chalks up carbon savings very quickly, is to not drive. In this regard, virtue signalling, can in fact be a virtue.
3. EVAS: ATTITUDES TOWARDS ELECTRIC VEHICLES
Car-lite travel is the most environmentally friendly way to travel in terms of carbon emissions. However, for those who still need to drive, EVs have emerged as a solution to cut down emissions due to driving. But how might we convince current and aspiring car owners to switch over to EVs?
Demand for Cleaner Energy Vehicles
From EVAS, we find that Singaporeans have generally positive sentiments towards EVs: 65% of respondents recognise that they provide environmental benefits, and close to 7 in 10 would support services that offer greener transport options (e.g., JustGrab Green). Furthermore, the transition to EVs appears to be gaining traction as 45% of respondents state that they would consider buying an EV for their next vehicle purchase. This preference for EVs is stronger among existing vehicle owners (48% plan to buy an EV) than non-vehicle owners (41% plan to buy an EV).
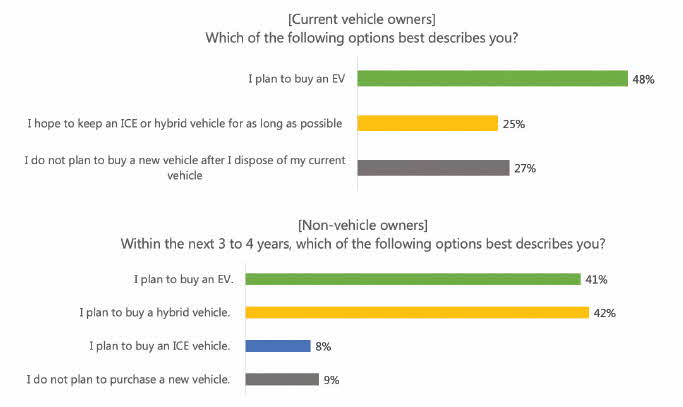
Figure 8. EV Purchase Intentions among Vehicle Owners and Non-Vehicle Owners
While these findings suggest stronger demand for EVs, we also find a substantial proportion of individuals who are still hesitant to go for fully electrified vehicles. About 1 in 4 vehicle-owning respondents say they hope to keep an ICE or hybrid vehicle for as long as possible. Among non-vehicle owners, around 40% would consider a hybrid or ICE vehicle. These findings are robust even in a hypothetical scenario in which the driving time to the nearest petrol station is doubled from their current experience.
The strong current preference for hybrid vehicles is perhaps not surprising given that the EV charging infrastructure is in its nascent stage and the number of EV models available in Singapore is limited today. Once the EV charging network expands and more vehicle manufacturers ramp up EV production in the years ahead, we can expect EV adoption to pick up as well.
Promoting car-lite living based on environmental reasons may have limits, as not all may feel the same urgency to tackle these concerns.
Barriers to EV Adoption
Not unexpectedly, we find the high purchase cost of EVs to be one of the top barriers of EV adoption, with 56% of respondents selecting it as a main deterrent (see Figure 9). Several measures to help improve price parity between EVs and conventional vehicles have been introduced, including the introduction of the EV Early Adoption Incentive, and revising the road tax framework for EVs. Over time, we expect the cost of an EV to fall a battery technology matures.
Other oft-indicated factors relate to the EV charging infrastructure, including insufficient charging points and uncertainty over the location of these facilities. Many disagree that fitting 1 in 10 parking lots with slow (overnight) chargers would be sufficient; in fact, 41% of respondents feel that more than half of the parking lots should have EV charging capabilities by 2030. This is much higher than LTA’s estimates of a 5 to 1 vehicle to charger ratio as being sufficient to meet EV charging needs by 2030, as estimated from typical usage patterns that result in the need for overnight charging only once every 5 to 7 days. Nevertheless, even as we seek to calibrate public expectations regarding the EV charging infrastructure, we are also ramping up the number of EV charging points across the island to about 60,000 by 2030.
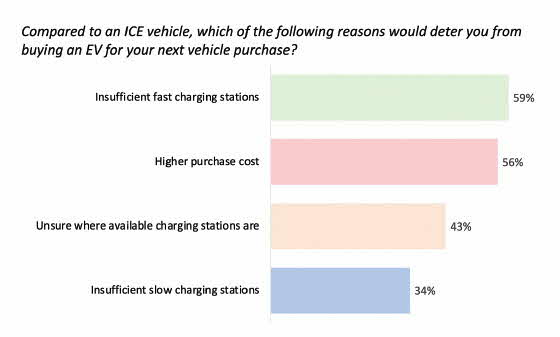
Figure 9. Main Deterrents of EV Adoption (as identified by respondents to be among their top 3 deterrents)
Striking a Balance between Encouraging EV Adoption and a Car-lite Lifestyle
LTA has rolled out a public education campaign titled “Power Every Move” in March 2022 to raise awareness of EVs—both cars and buses—and their benefits to the environment such as cleaner air and quieter roads. While widespread adoption of EVs is necessary to curb the harmful emissions from ICE vehicles, we also need to be mindful that our pro-EV initiatives and messaging do not inadvertently fuel car ownership desires. More or equal emphasis to encourage the use of public transport modes must be maintained in our overall messaging.
We observe in our GCY survey that 43% of youths with no initial car ownership aspirations agree that pro-EV initiatives would encourage them to own an EV (see Figure 10). In addition, 58% of those initially undecided about car ownership feel the same way. Combined, this is a substantial group of people whom we would risk swaying into desiring to own an EV even though they did not plan to own cars to begin with.
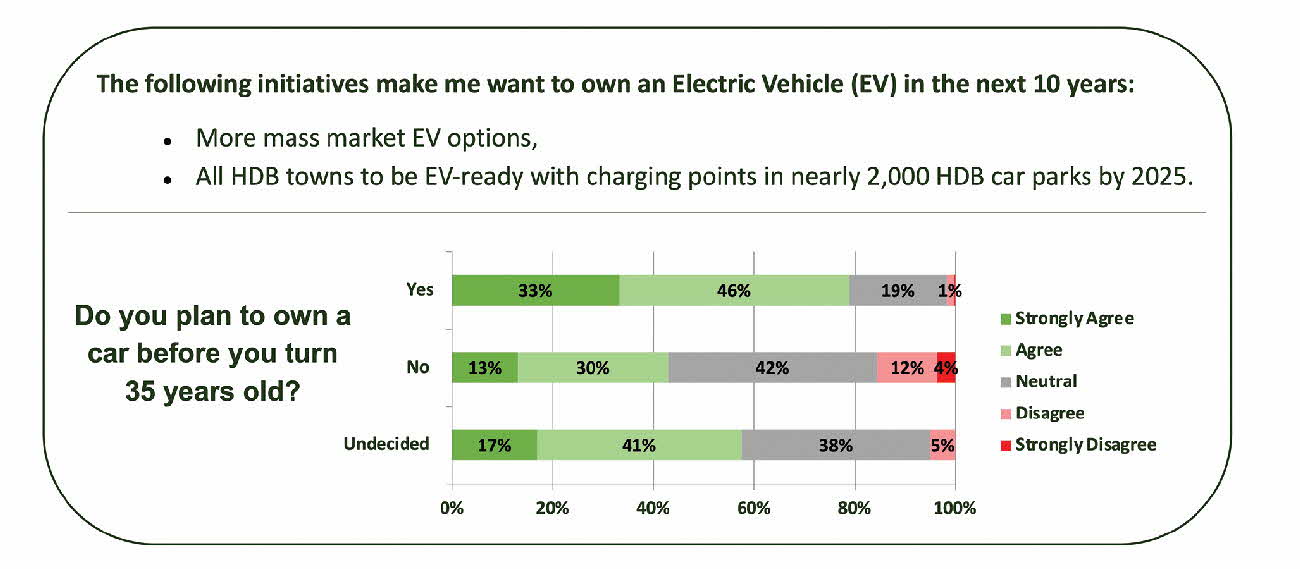
Figure 10. EV Adoption Due to Infrastructural Improvements—Breakdown by Car Ownership Aspirations
How should policymakers respond to the insights gleaned from these studies into public attitudes towards greener transport options?
WHERE WE MIGHT GO FROM HERE
How should policymakers respond to the insights gleaned from these studies into public attitudes towards greener transport options?
We propose three approaches to influencing transport behaviour, based on behavioural science—a field that encompasses holistic interventions to educate, empower, excite, and entrench behaviour.
1. Time policy interventions right.
This is vital when tackling ingrained habits. For instance, at significant temporal landmarks (e.g., at the start of a new year), people become more sensitive to new information and open to change: what has been called the fresh start effect.1 Travel behaviour, being habitual in nature, can become more malleable during certain ‘fresh starts’.
The upcoming opening of several new rail lines in Singapore could serve as valuable ‘fresh starts’ to harness, especially for residents staying near these new stations. As a general principle, the government should use these timing opportunities to multiply the effects of car-lite interventions or policies.
2. Help drivers commit to car-lite goals.
Our findings show that a substantial number of drivers want to reduce car use but face an intentionaction gap. They could benefit from a range of self-control and commitment techniques drawn from behavioural science.
One highly promising technique is gamification. Countries such as Japan have used gamification to create exciting and novel experiences that draw commuters to PT.2 In Singapore, LTA has used gamification to promote car-lite travel to school among primary school students in small-scale trials (e.g., the Kids Smart Travel Challenge),3 with highly encouraging results. Private firms have also created gamified travel experiences for adults, while commercial apps have turned habit formation into an enjoyable ‘quest’. Policymakers could make use of these innovations to attract and habituate drivers to a car-lite lifestyle, while maintaining the loyalty of existing PT users.
3. Design for different people.
Population segmentation is a valuable tool for behavioural scientists and policymakers alike. By recognising the heterogeneity within a population, we gain a more precise view of stakeholders and can then tailor interventions to better cater to different preferences and needs. One data-driven approach to segmentation is to cluster people along several dimensions to form nuanced archetypes. For instance, in GCY, we segment our youth respondents into three distinct archetypes: namely the pro-environmentalists, ambivalent personas, and car lovers (see Figures 1 and 2 below). One insight we find is that while further environmental messaging may encourage ambivalent personas to go carlite, a different approach—potentially focusing on other negative externalities (e.g., traffic congestion)—may be needed to reach the pro-environmentalists who still plan to own a car.
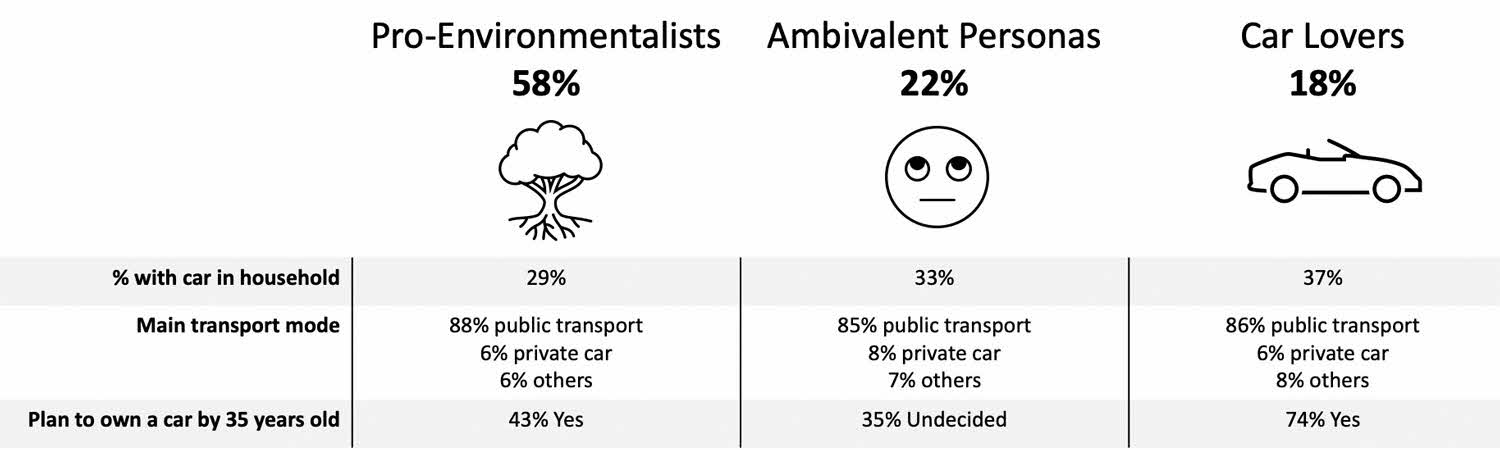
Figure 1. Archetypes of Youth Non-Vehicle Owners and Car Ownership Aspirations
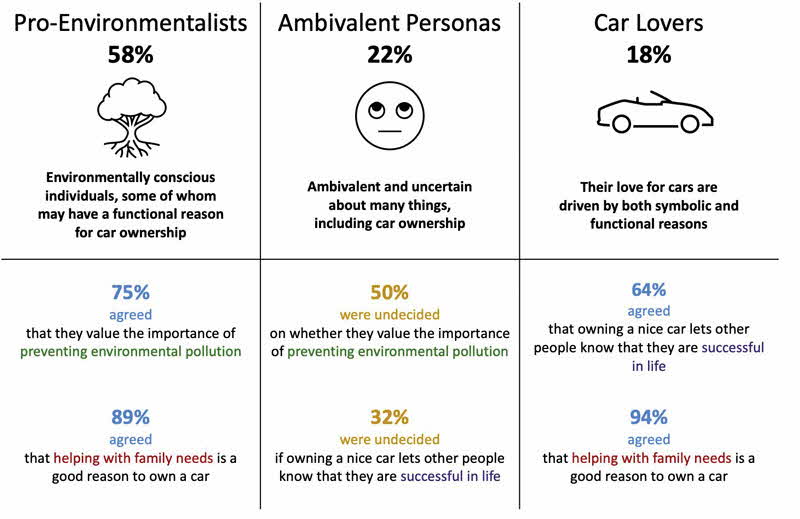
Figure 2. Archetypes of Youth Non-Vehicle Owners and Characteristics
Notes
Hengchen Dai, Katherine L. Milkman, and Jason Riis, “The Fresh Start Effect: Temporal Landmarks Motivate Aspirational Behavior”, Management Science 60, no. 10 (June 2014), https://pubsonline.informs.org/doi/abs/10.1287/mnsc.2014.1901 (opens in new tab).
“Tokyo Metro—The Underground Mysteries 2019” Puzzle-Solving & City Exploration Game event, https://www.tokyometro.jp/lang_en/news/202971.html?width=816&height=650 (opens in new tab).
Do Hoang Van Khanh and Low Weijian, “Encouraging Car-Lite Travel through Gamification: The Kids Smart Travel Challenge”, Ethos Digital 5 (November 2019), https://www.csc.gov.sg/articles/encouraging-car-lite-travel-through-gamification-the-kids-smart-travel-challenge (opens in new tab).
CONCLUSION
Sustainability, in its many forms, has always been a central theme running through Singapore’s land transport story. While environmental sustainability has been more strongly emphasised in recent years, we should be mindful that promoting car-lite living based on environmental reasons may have limits, as not all groups may feel the same urgency to tackle these concerns. For those who are contented car users, there are fundamental issues (e.g., cost and charging infra-availability) that must be addressed before they can be persuaded to switch to EVs. We need more innovative thinking informed by research, to break the car habit and move people from intention to action.
Nevertheless, we are optimistic that Singaporeans, and especially our next generation, are prepared to embrace green transport by making car-lite choices every day. With continued focus on green plans in the coming decades, our goal to cut peak land transport emissions by 80% by 2050 is looking achievable. Through a collective effort, we look forward to an even greener land transport for Singapore in the years to come.
The authors wish to thank the following for their contribution to the findings of this
article: Professor Leonard Lee, National University of Singapore; Professor Ziv Carmon,
INSEAD; Assistant Professor Charlene Chen Yijun, Nanyang Technological University;
Yuen Wei Lun, PhD Student, National University of Singapore; Koh Puay Kee, Ministry
of Communications and Information; and Grace Ang, Ministry of Communications
and Information.
ABOUT THE AUTHORS
Chong Wen Wei is Behavioural Scientist in the Economics Unit, Policy & Planning Group of the Land Transport Authority. He focuses on applying behavioural/psychological tactics and empirical methods to promote people-centric design and strategy.
Leong Wai Yan is Chief Transport Economist in the Economics Unit, Policy & Planning Group of the Land Transport Authority. He oversees the Economics Unit.
Karenza Mosquera is Economist in the Economics Unit, Policy & Planning Group of the Land Transport Authority. Her current work areas include conducting research to understand public acceptance and attitudes towards transport policies and initiatives.
Ng Kai Xuan is Economist in the Economics Unit, Policy & Planning Group of the Land Transport Authority. Her current work entails experimental design and empirical analysis in the behavioural research domain to facilitate policymaking.
Ng Sheng Yang is Economist in the Economics Unit, Policy & Planning Group of the Land Transport Authority. His current work areas include conducting research on travel behaviours and vehicle markets to support policy development.
NOTES
Singapore has not been, and will not be, spared. Average temperatures in our coastal city-state have risen by more than 1°C over the past 40 years. By the end of the century, the National Climate Change Secretariat projects a further increase of 4.6°C in temperature and a 1 m rise in sea levels.
National Climate Change Secretariat, “Singapore’s Emissions Profile”, accessed May 2, 2022, https://www.nccs.gov.sg/singapores-climate-action/singapores-climate-targets/singapore-emissions-profile/ (opens in new tab).
SG Green Plan, “Singapore Green Plan 2030 Green Targets”, accessed May 2, 2022, https://www.greenplan.gov.sg/targets (opens in new tab).
Land Transport Authority, “Reducing Peak Land Transport Emissions by 80%”, accessed May 2, 2022, https://www.lta.gov.sg/content/ltagov/en/newsroom/2022/3/news-releases/reducing-peak-land-transport-emissions-by-80-.html (opens in new tab).
While this study is currently unpublished, the National University of Singapore (NUS) has granted us permission to reveal some of the highlights.
Sebastian Bamberg, “Changing Environmentally Harmful Behaviors: A Stage Model of Self-Regulated Behavioral Change”, Journal of Environmental Psychology 34 (2013): 151–159.