The Nordic Social Security Model: Squaring the Circle?
ETHOS Issue 03, Oct 2007

The challenge facing many developed countries today is how to strike a balance between preserving economic growth, and enhancing social welfare to mitigate the ills of economic growth. Countries face pressure on the one hand to keep tax rates low and regulation light to stay competitive; on the other, to raise taxes in order to fund redistributive policies that reduce income inequality and strengthen social security.
There has been some attention of late on the Nordic states (Sweden, Denmark, Finland and Norway), who appear to have found a virtuous compromise between staying competitive and ensuring social security for their citizens. In December 2006, an inter-ministry team from Singapore made a study trip to Denmark and Sweden to study their social security system. This article highlights some of our findings.
MAKING IT WORK
The Nordic social security system is based on the belief that the state should strive to ensure equality of outcomes and social security. Redistribution, through taxes and transfers, is an explicit goal of Nordic social policy. Benefits are universal, and means-testing, to the extent that it is applied, determines only the amount of benefit a person shall receive, not whether he should receive any benefit at all. There are clear, publicly known rules governing how much social security benefits someone may receive and for how long.
The Danish "flexicurity" system claims to combine labour market flexibility with employment security.
One of the key innovations of the Nordic model is the reconciliation of an efficient labour market with a comprehensive social security system. The Danish “flexicurity” system, for example, claims to combine labour market flexibility with employment security. (Although the term was coined by the Danish, the system is employed to varying degrees in all the Nordic states.) “Flexicurity” consists of three components:
(a) a flexible labour market;
(b) generous unemployment insurance (UI) benefits; and
(c) active labour market policies/ programmes (ALMPs).
All three are necessary to balance one another. A flexible labour market, for example in terms of hiring and firing workers, lowers the cost of labour for employers and enhances economic competitiveness. The uncertainty and volatility it creates for workers is mitigated by generous UI benefits, which are partly funded by worker contributions and mostly by the state.
Work-based Criteria
To reduce the disincentive to work created by the UI scheme, unemployed workers have to register at the state public employment offices and undertake to accept the first suitable job offered in order to receive their UI benefits. To help unemployed workers return to the workforce as quickly as possible, they can take part in ALMPs, which fall into four broad categories: adult training (encompassing both formal and informal training, work-related education and personal development programmes), job search services (such as job matching and counselling) and sanctions on UI benefits if the work conditions are not complied with, incentive programmes for private sector employers (e.g., wage subsidies), and direct employment programmes in the public sector.
Consequently, employment churn is high: in Denmark, for instance, worker turnover is estimated to be about 30% in any given year, and it is considered normal to have five or six jobs over one’s career with unemployment spells lasting about three to five weeks. About 60% of registered unemployed people find jobs after two months;1 22.6% of the total unemployed are considered long-term unemployed (generally more than one year of unemployment).2 At the same time, at least 80% of workers are members in a UI fund (85% to 90% in Sweden), even though membership is voluntary, which is remarkable in a scheme that in theory should be too susceptible to adverse selection to be viable without mandatory participation.3
Partnership with Unions
The “flexicurity” system would not be possible without the cooperation of the “social partners”, namely the trade unions and employers’ organisations. However, unions are a double-edged sword: they both enable and lock in the present labour market policy. Having the unions on their side, for example, makes it difficult for the government to scale back on UI benefits, as the new Swedish government was trying to do. The union-negotiated wage forms the de facto minimum wage, as it applies to all workers in the industry, union member or not, citizen or foreigner.
The relationship between the government and the unions may be changing: Although unionisation rates are still very high, union membership is falling, in part because the young are less interested in the unions, especially when faced with a strong labour market, and in part because of the growing trend in part-time and informal work. At the time of our visit, the new Swedish government was considering making UI fund membership compulsory, to sever the historical link between UI fund and union membership, which would weaken the unions.4
The Cost of Welfare
The Nordic competitive strategy is familiar to Singapore, with its focus on rising above labour costs and moving up the value chain into more productive and knowledge-intensive industries. Strong economic fundamentals in the Nordic states present a stable and attractive environment for business. Sweden and Denmark, for example, have enjoyed budget surpluses of about 2.3% GDP over the past five years. Domestic inflationary pressures have also been kept in check, averaging at about 1% to 2%. Strong international competition has also spilled over to industries competing in the domestic market and restrained cost inflation through higher productivity growth and lower wage growth. For both countries, low inflation reflects high productivity growth.
There is substantial emphasis on the development of human and knowledge capital. The Danes and Swedes, for example, are one of the best-educated populations in the world, with 35% of Danes and 42% of Swedes attaining tertiary education.5 In addition to the formal education system, there are also long-standing traditions of life-long learning for adults.6 The Nordic states also spend about 2% to 3% of GDP on research and development, but spending is not limited to government—60% of R&D expenditure in Denmark, Sweden and Finland comes from industry.
These strategies have enhanced Nordic competitiveness and contributed to the viability of the Nordic states so far. However, the welfare state still exacts its price. For example, one of Denmark’s research institutes, the Rockwool Foundation Research Unit, recommended eliminating the highest tax bracket as a way to increase tax revenue for Denmark, in view of the strong disincentives for the top earners to work more.7 Denmark and Sweden have both sought to strengthen incentives to work by introducing an Earned Income Tax Credit (EITC) scheme in 2004 and 2006 respectively, to make work more attractive, and to distinguish (in a philosophical departure) earned income from transfer income.8
Our future test for the Nordic model will be whether it is able to sustain an ageing population and the growing number of immigrants.
Changing Demographics and Social Norms
One future test for the Nordic model will be a demographic one—whether the state is able to sustain its ageing population and growing number of immigrants. Preliminary estimates by the Swedish government suggest that they will be able to sustain their social security system in the face of an ageing population, as long as they do not need to raise the level or quality of existing services. They will do so in part by maintaining a budget surplus of 2% GDP over the business cycle until 2015, which can be used to reduce public debt roughly to the 2005 debt level.
In response to this trend, the key strategy of the new Swedish government is to strengthen the labour market: increase the demand for labour by reducing payroll taxes for older and younger workers, and increase the supply of labour by maintaining a high level of employment. Denmark, on the other hand, is projected to be in the red from 2016 onwards, with a total public deficit of about 8% by 2029. Nonetheless, the Danes are optimistic that the new Welfare Agreement cemented between all the major parties in 2006 will enhance the fiscal sustainability of their model, primarily by raising the retirement age for voluntary early retirement pensions and public old-age pensions from 2019, and by indexing the retirement age thresholds to the life expectancy of 60-year-olds, which is about 19.5 years, so that the government can reduce its outlay on old-age pensions and stabilise outlay even as life expectancies increase.
The other demographic challenge is immigration. This is in part an economic dilemma, because the Nordic countries take in a good number of political immigrants, who tend to have lower employment rates than locals. It is also a social challenge—the Nordic social security system is a pay-as-you-go scheme, and by definition depends on the willingness of each new generation to pay for the last one. An influx of immigrants who do not share the same social philosophy or work ethic (so far away from Max Weber) strains the intergenerational social compact that the Nordic model is built on.
The worry is not only with immigrants; some feel that the young seem to be more materialistic than in the past and less willing to pay top tax rates in exchange for social security.9 Critics of the Nordic model point out that in some aspects, it is too good to be true: the official unemployment figures, for example, hide high public sector employment (about 30% of the total work force), participation in labour market programmes, including wage-subsidised jobs, and withdrawals from the workforce due to sick leave or early retirement. A McKinsey article in June 2006 estimated that the actual unemployment rate in Sweden was 17% (11% more than the official rate). This 17% included people on labour market programmes, latent job candidates, the under-employed and those excluded from the workforce but able to work (for example, on early retirement or sick leave beyond Sweden’s normal historic levels from the 1970s).10
A QUESTION OF VALUES
It is tempting to talk about social security systems in abstraction, but a social security system depends, first and foremost, on the social values of the people who depend on it and who pay for it with their tax dollars. The Nordic model is an interesting way of incorporating work into the heart of a welfare system—if a welfare system is what is needed. Citizens encountered in the course of the study trip seemed to be genuinely proud of their social security system; although aware of its faults, they seemed to feel that the social values embedded into the system were worth preserving, even at the cost of high taxes.
In terms of policy directions or programmes, it would difficult to import most features of the Nordic model into the Singapore system as it is premised on an entirely different social philosophy, and each component of the social security system is integrated with and dependent on the others. The question, at the end of the day, could simply be: what do we believe in? It starts there.
WHAT IS THE NORDIC MODEL?
The “Nordic model” can be broadly characterised as a high-tax, high-expenditure social democratic welfare state — except with the labour market flexibility and economic competitiveness of a liberal welfare state.
Table 1 provides a simplified characterisation of different European social models.
TABLE 1: CHARACTERISATION OF SOCIAL MODELS11

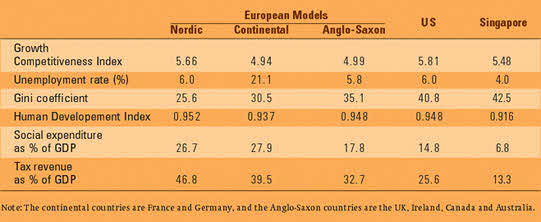
The Nordic states appear to have done well both on measures of competitiveness and social outcomes (Table 2).
TABLE 2: COMPARISON OF ECONOMICAL AND SOCIAL OUTCOMES12

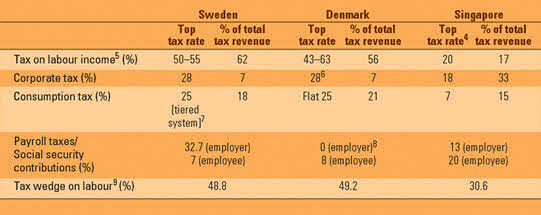
As indicated in Table 2, the high emphasis on social welfare is paid for by some of the highest tax rates in the world (Table 3).
TABLE 3: TAX RATES AND COLLECTIONS IN SWEDEN, DENMARK AND SINGAPORE13

Tax revenues have averaged at about 50% of GDP over the past five years. Although taxes on labour income are arguably high enough to be on the wrong side of the Laffer curve,20 this is as efficient a tax mix as can be expected given their revenue needs, with higher taxes on labour income and consumption, and regionally comparable taxes on corporate and capital income.
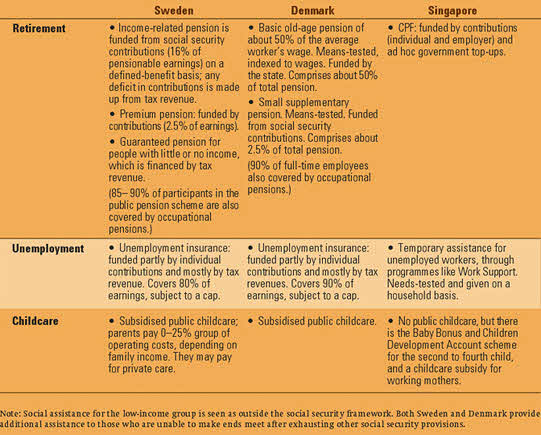
Table 4 outlines the benefits enjoyed in the Nordic states, relative to comparable social measures in Singapore.
TABLE 4: COMPARISON OF BENEFITS IN SWEDEN, DENMARK AND SINGAPORE

NOTES
- Meeting with the National Directorate of Labour, Denmark (5 December 2006).
- OECD Factbook 2006 (Paris: Organisation for Economic Co- operation and Development, 2006).
- The replacement rate and duration of UI benefits in both Denmark and Sweden are among the highest in Europe. In Denmark, an unemployed person can receive UI benefits for up to four years, at a maximum replacement rate of 90%, subject to a cap. The average replacement rate is 69%. In Sweden, an unemployed person can receive UI benefits for 300 days, at a maximum replacement rate of 80%, subject to a cap. The average replacement rate is 63%. (Source: OECD Employment Outlook - 2006 Edition: Boosting Jobs and Incomes (Paris: Organisation for Economic Co-operation and Development, 2006). Membership fees are low; in Sweden, government funds covered about 90% of UI payouts, and membership fees only 10%. In Denmark, membership fees covered 50% of payouts in 2005, but only 25% a few years ago, when unemployment rates were higher. (Source: meetings with the Unemployment Insurance Board in Sweden, 27 November 2006, and the National Directorate of Labour in Denmark, 2 December 2006).
- Meeting with Dr Lotti Ryberg-Welander, Stockholm University, Department of Social Work, 1 December 2006.
- The Global Competitiveness Index 2006 ranked Denmark second in higher education and training, followed by Sweden in 3rd place. Finland took first place.
- Expenditure on adult training programmes forms about 0.5% of Denmark’s GDP, and 0.3% for Sweden (Nordic Social- Statistical Committee (NOSOSCO), 2006, Social Protection in the Nordic Countries 2004: Scope, Expenditure and Financing, pg.227.).
- From the paper “Tax, Work and Equality – a Study of the Danish Tax and Welfare System,” Rockwool Foundation Research Unit.
- Meeting with the Swedish Ministry of Finance, 30 November 2006.
- Meeting with Dr Lotti Ryberg-Welander, Stockholm University, Department of Social Work, 1 December 2006.
- “Sweden’s Growth Paradox,” The McKinsey Quarterly, June 2006. Public sector employment figures from Hans Werner Sinn, “Scandinavia’s Accounting Trick,” Project Syndicate 2006.
- Schubert, Carlos Buhigas, and Martens, Hans, “The Nordic Model: A Recipe for European Success?” (European Policy Centre (EPC) Working Paper No. 20, September 2005).
- Sources: Growth Competitiveness Report 2005, OECD Factbook 2006, UN Human Development Report 2005, and the CIA World Factbook 2006.
- Sources: Swedish Ministry of Finance, Danish Ministry of Finance, Singapore Ministry of Finance (Budget Highlights 2005), and OECD Tax Database.
- The top tax rate on labour income was lowered to 20% in YA2007 from 21% in 2005. The headline corporate tax rate lowered to 18% with effect from YA2008; and the GST rate increased to 7% with effect from 1 July 2007.
- Tax on labour income includes payroll taxes for Sweden and Denmark. For Singapore, CPF contributions are excluded as they are not considered as part of government tax revenue.
- In January this year, the Danish government lowered the top CIT rate from 28% to 22%.
- There are reduced VAT rates for Sweden: 12% for food and hotel charges; 6% for personal transportation, publications, entrance fees to commercial sports activities and cultural events; and exemptions for healthcare and other services.
- But an annual lump sum charge applies.
- Figures for Denmark and Sweden are from the OECD Tax Database. The figure for Singapore is based on an average wage of S$3,444 (Labour Force Survey 2005), and the employer CPF contribution rate of 20%, employee contribution rate of 13%, $1,000 annual earned income relief and the personal income tax schedule for YA2006.
- From the paper “Tax, Work and Equality – a Study of the DanishTax and Welfare System,” Rockwool Foundation Research Unit, 2006.

